Type
Enterprise Application
Format
Desktop
Area
UX Research; UX Design
Employer
Lexmark
Tools
Adobe XD, Figma, Miro, Microsoft Teams, Userlytics.com
Team
Developers, Product Owner, Data Scientists, ML Ops, UI Designer
Redesigning a No-Code Data Pipeline Tool
Redesigning a No-Code Data Pipeline Tool
Redesigning a No-Code Data Pipeline Tool
Redesigning a No-Code Data Pipeline Tool
Type
Type
Type
Enterprise Application
Enterprise Application
Enterprise Application
Format
Format
Format
Desktop
Desktop
Desktop
Area
Area
Area
UX Research; UX Design
UX Research; UX Design
UX Research; UX Design
Employer
Employer
Employer
Lexmark
Lexmark
Lexmark
Tools
Tools
Adobe XD, Figma, Miro
Adobe XD, Figma, Miro
Team
Team
Developer, Product Owner, Data Scientists, ML Ops, UI Designer
Developer, Product Owner, Data Scientists, ML Ops, UI Designer
Tools
Adobe XD, Figma, Miro, Microsoft Teams, Userlytics.com
Team
Developers, Product Owner, Data Scientists, ML Ops, UI Designer
Project Summary
I led the user experience redesign of Optra's Data Accelerator (ODA) desktop application, a no-code tool for creating and managing data pipelines. The goal was to transform their proof of concept into a user-friendly product that empowers data scientists and engineers to efficiently generate and adjust pipelines without needing to write or rewrite Python code. The redesign resulted in quicker user onboarding and time to value.
Background
Lexmark utilized decades of managing and printer fleets and the data they produce to create an offering called Optra--a platform for companies to manage their internet of things (IOT) data.
Background
Lexmark utilized decades of managing and printer fleets and the data they produce to create an offering called Optra--a platform for companies to manage their internet of things (IOT) data.
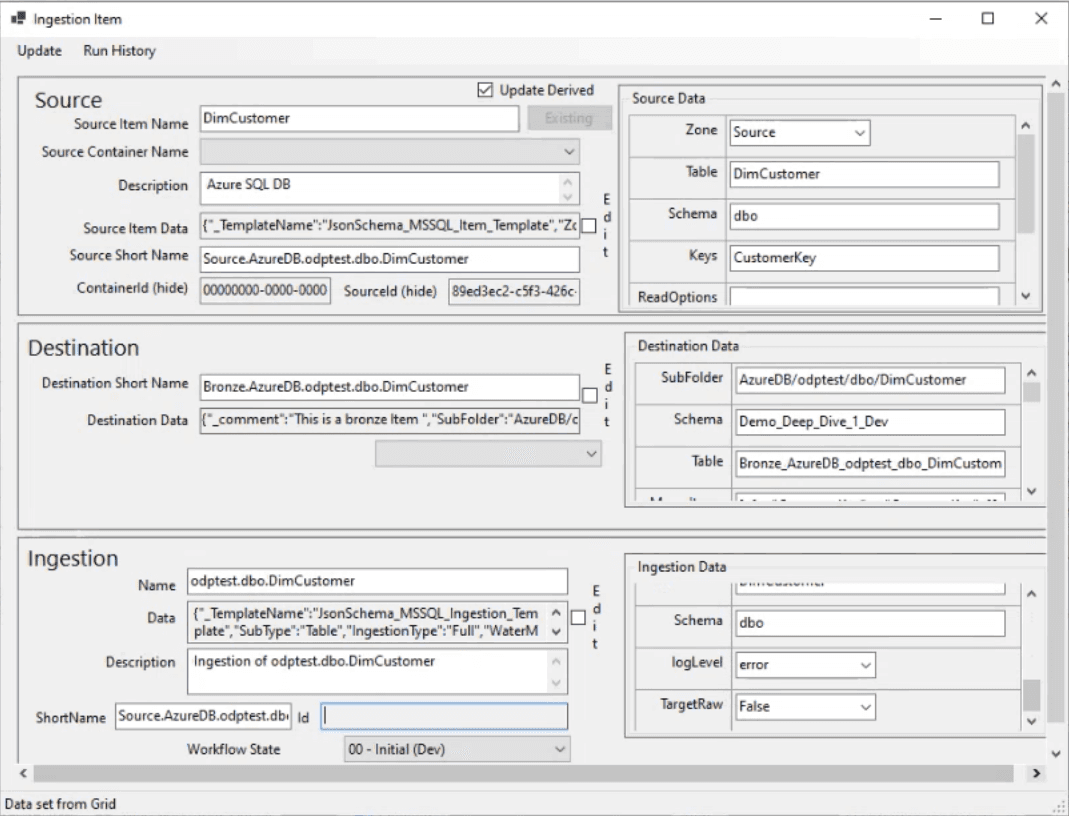
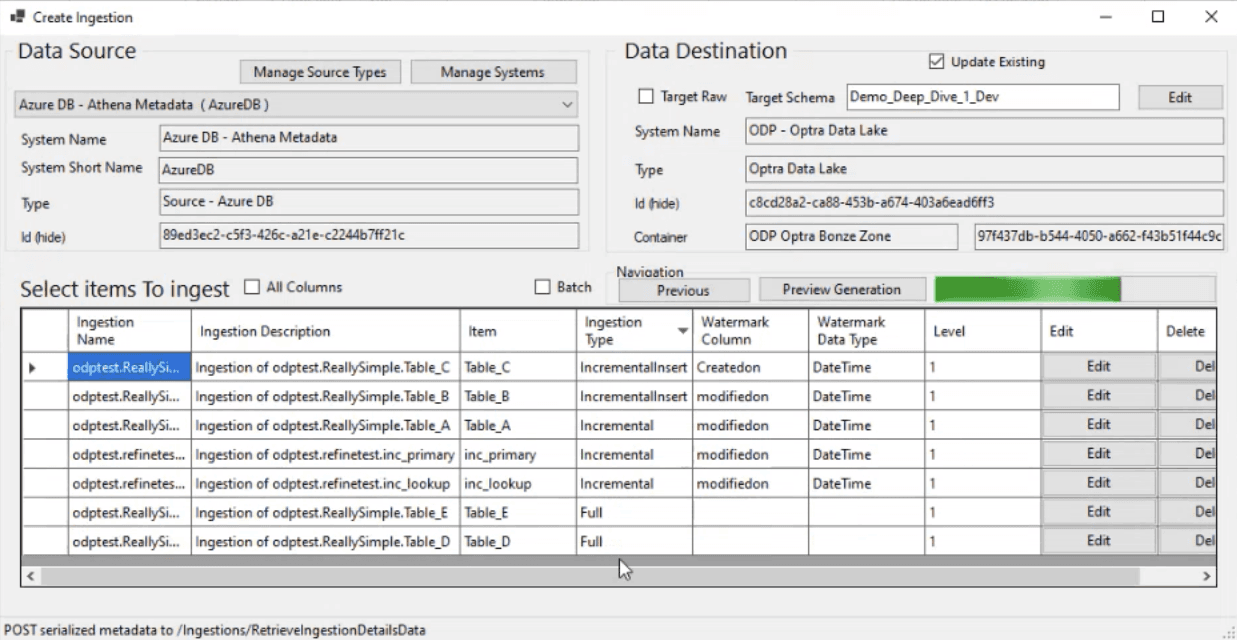
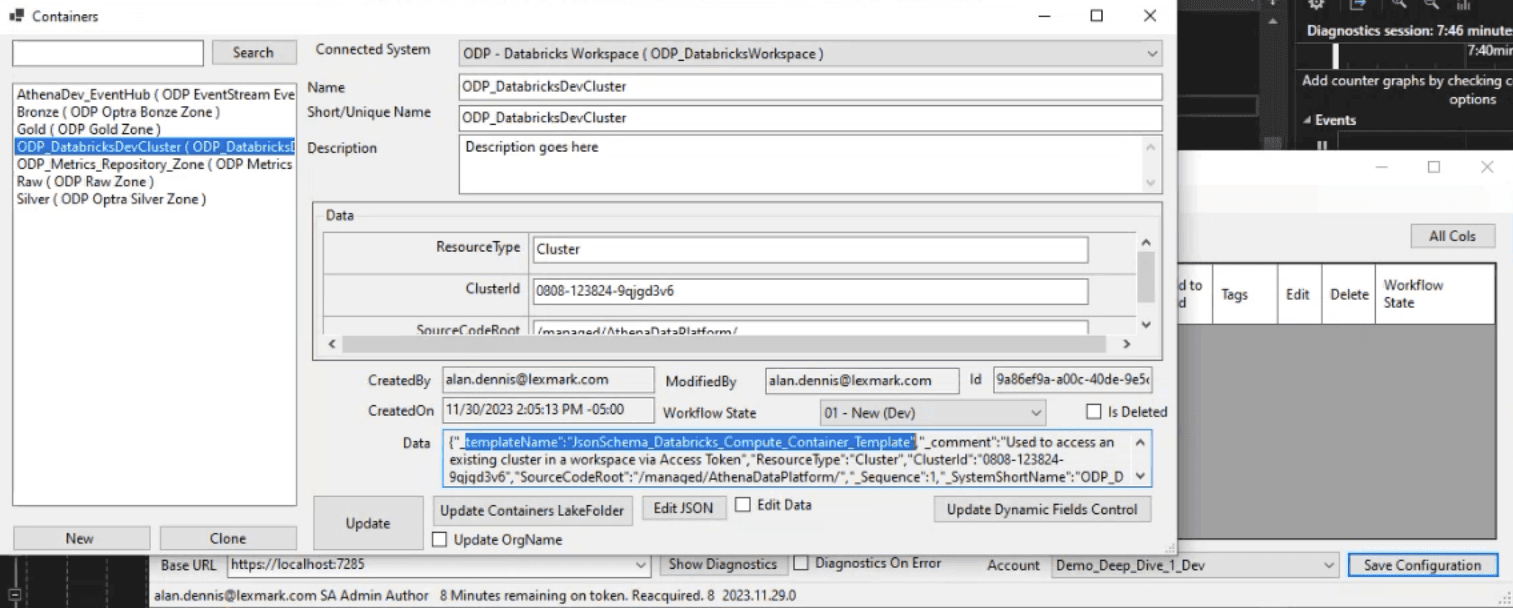
Original proof of concept screenshots
The Problem
How Might We Build The Confidence Of New Users?
Gleaning insight from data to make business decisions, a company needs high quality data. Going from "raw" to "silver/gold" (data that has been cleaned, standardized, and aggregated so it can be stored in a Data Lakehouse), a data engineer needs to build data pipelines to facilitate the transfer. A popular tool for this is Databricks, however the current process is slow (weeks can be spent building the pipelines) and requires programming knowledge.
The Optra Data Accelerator began as a proof of concept (POC) that allows users to create pipelines without writing code. It had great technical potential, but lacked an intuitive user experience. Users found the interface confusing, the workflows disjointed, and the overall process difficult to follow. The challenge was to redesign the pipeline creation process while reducing the learning curve.
My Role
As the UX lead, I was responsible for user research, design, prototyping, and testing. I worked alongside Optra’s product managers and development teams, data scientists and engineers, and a UI designer.
My Role
As the UX lead, I was responsible for user research, design, prototyping, and testing. I worked alongside Optra’s product managers and development teams, data scientists and engineers, and a UI designer.
Approach
Stakeholder Interviews
We began with stakeholder interviews to learn about the data science lifecycle and how data is collected and used in large enterprises. The interviews also clarified different roles of the users involved: data analysts, engineers, scientists, and machine learning operations leaders.
Goals: Understand the vision for ODA and align the UX design with business objectives--increasing adoption among data engineers and improving efficiency.
The stakeholders were aligned on creating a great onboarding and first-use experience. This would be a new way for engineers to work, so they need to get set up quickly and show the value of the tool in the first few minutes of use.
Stakeholder
Interviews
Track 1
Non-user Interviews
Current-user Interviews
Current
Future
Track 2
Improve
Current Features
Future Releases
New Info
New Info
New Info
Stakeholder
Interviews
Track 1
Non-user Interviews
Current-user Interviews
Current
Future
Track 2
Improve
Current Features
Future Releases
New Info
New Info
New Info
Primary Research
Planning: I developed a research plan that split into two tracks. One started with in-depth interviews with data scientists and engineers. The goal was to understand the challenges they face throughout the data lifecycle. This would help evaluate the proof of concept and begin creating solutions for future features.
Since we had a working POC, the second track of research focused on existing users. I led observation sessions where the users could walk me through their current use of the ODA to see how they used it, what they liked and disliked, and find pain points we could improve.
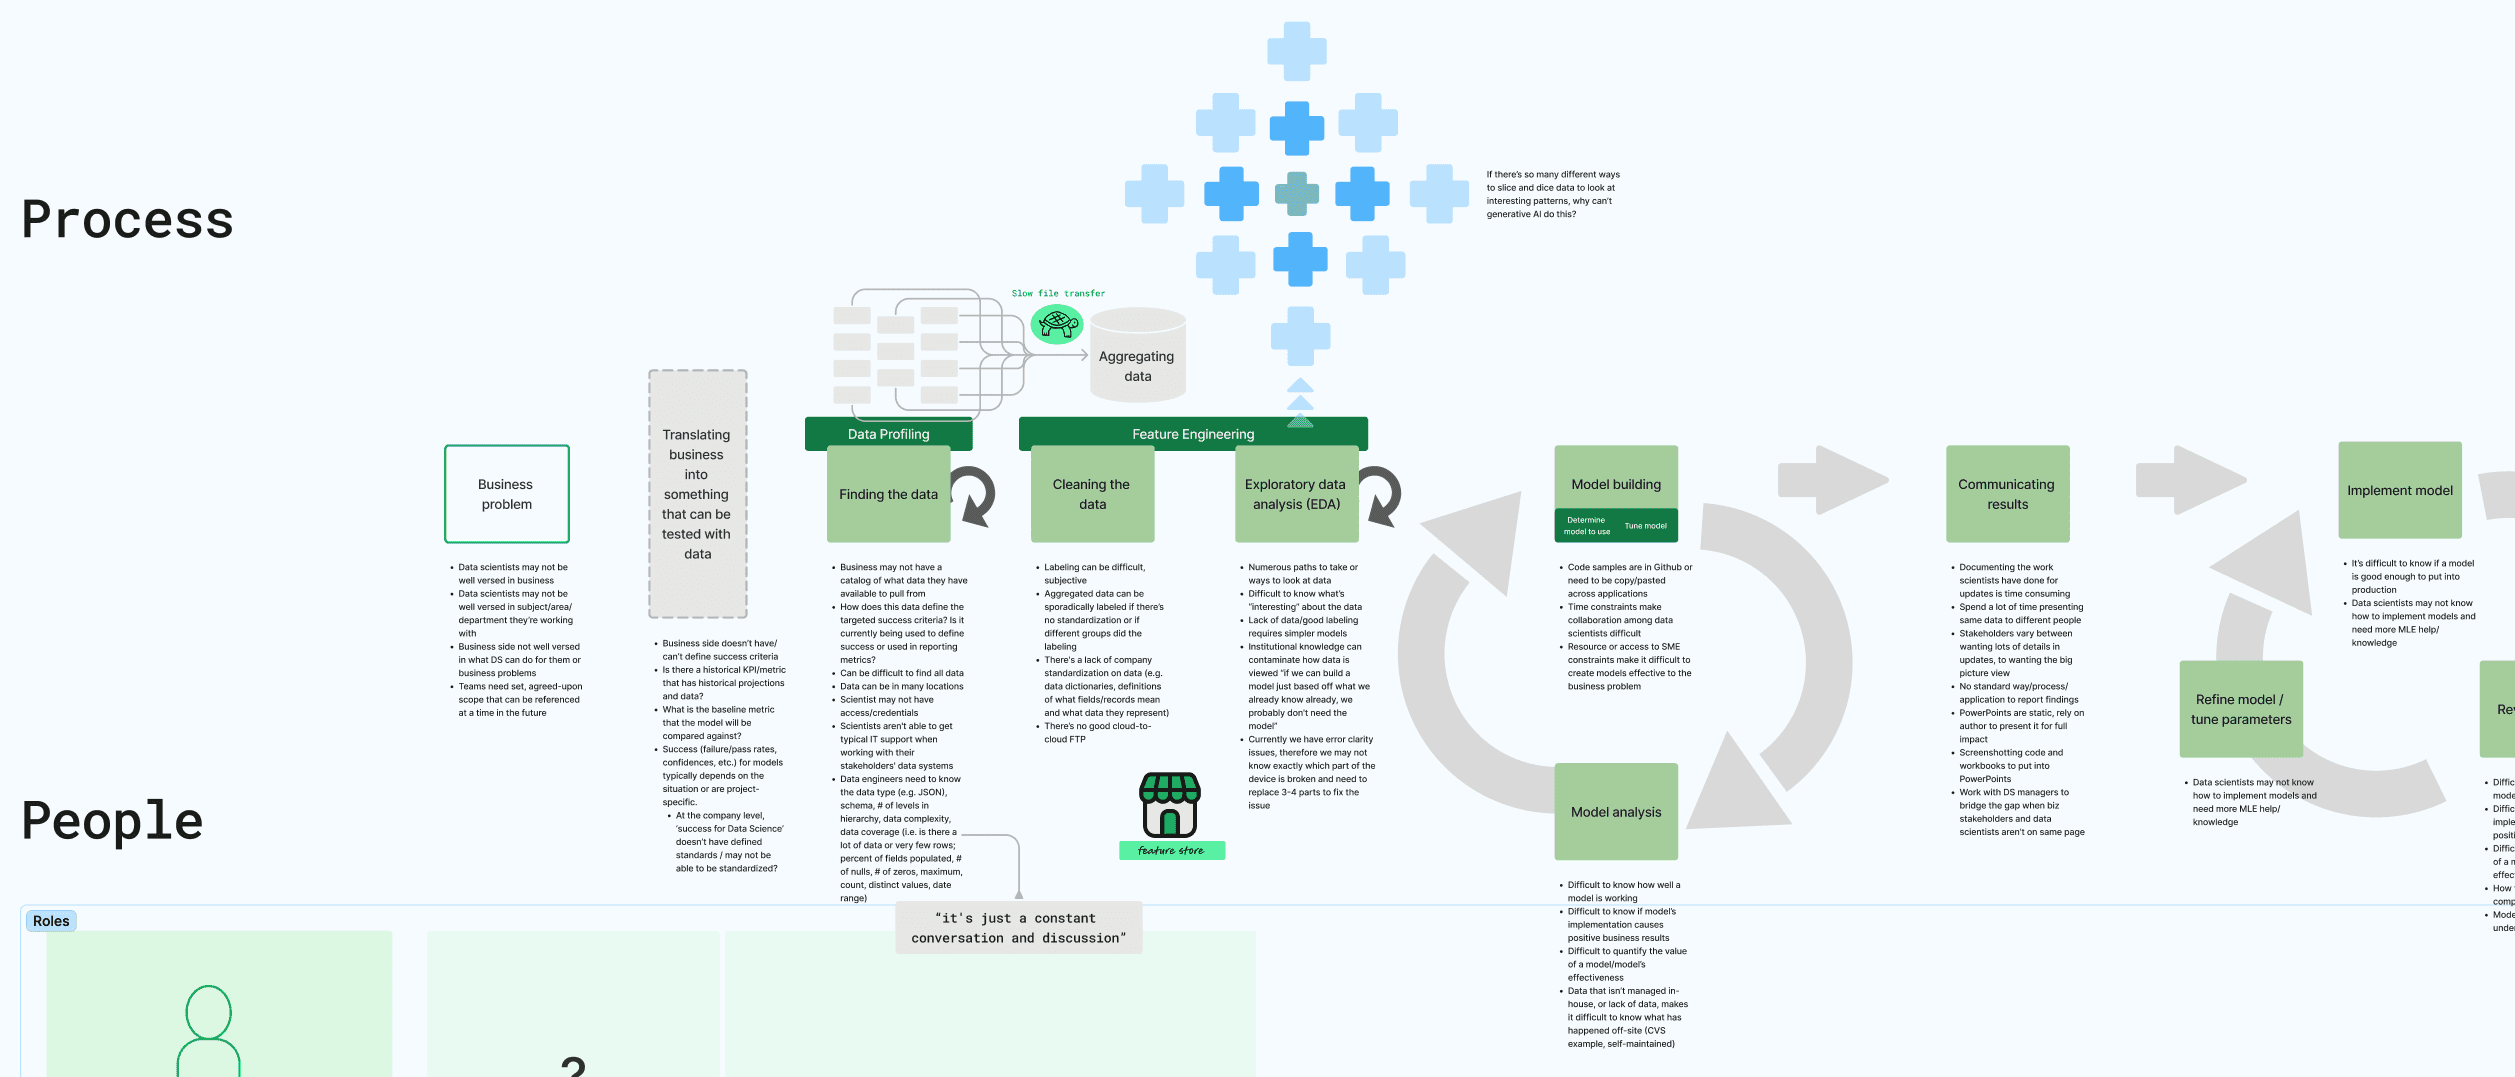
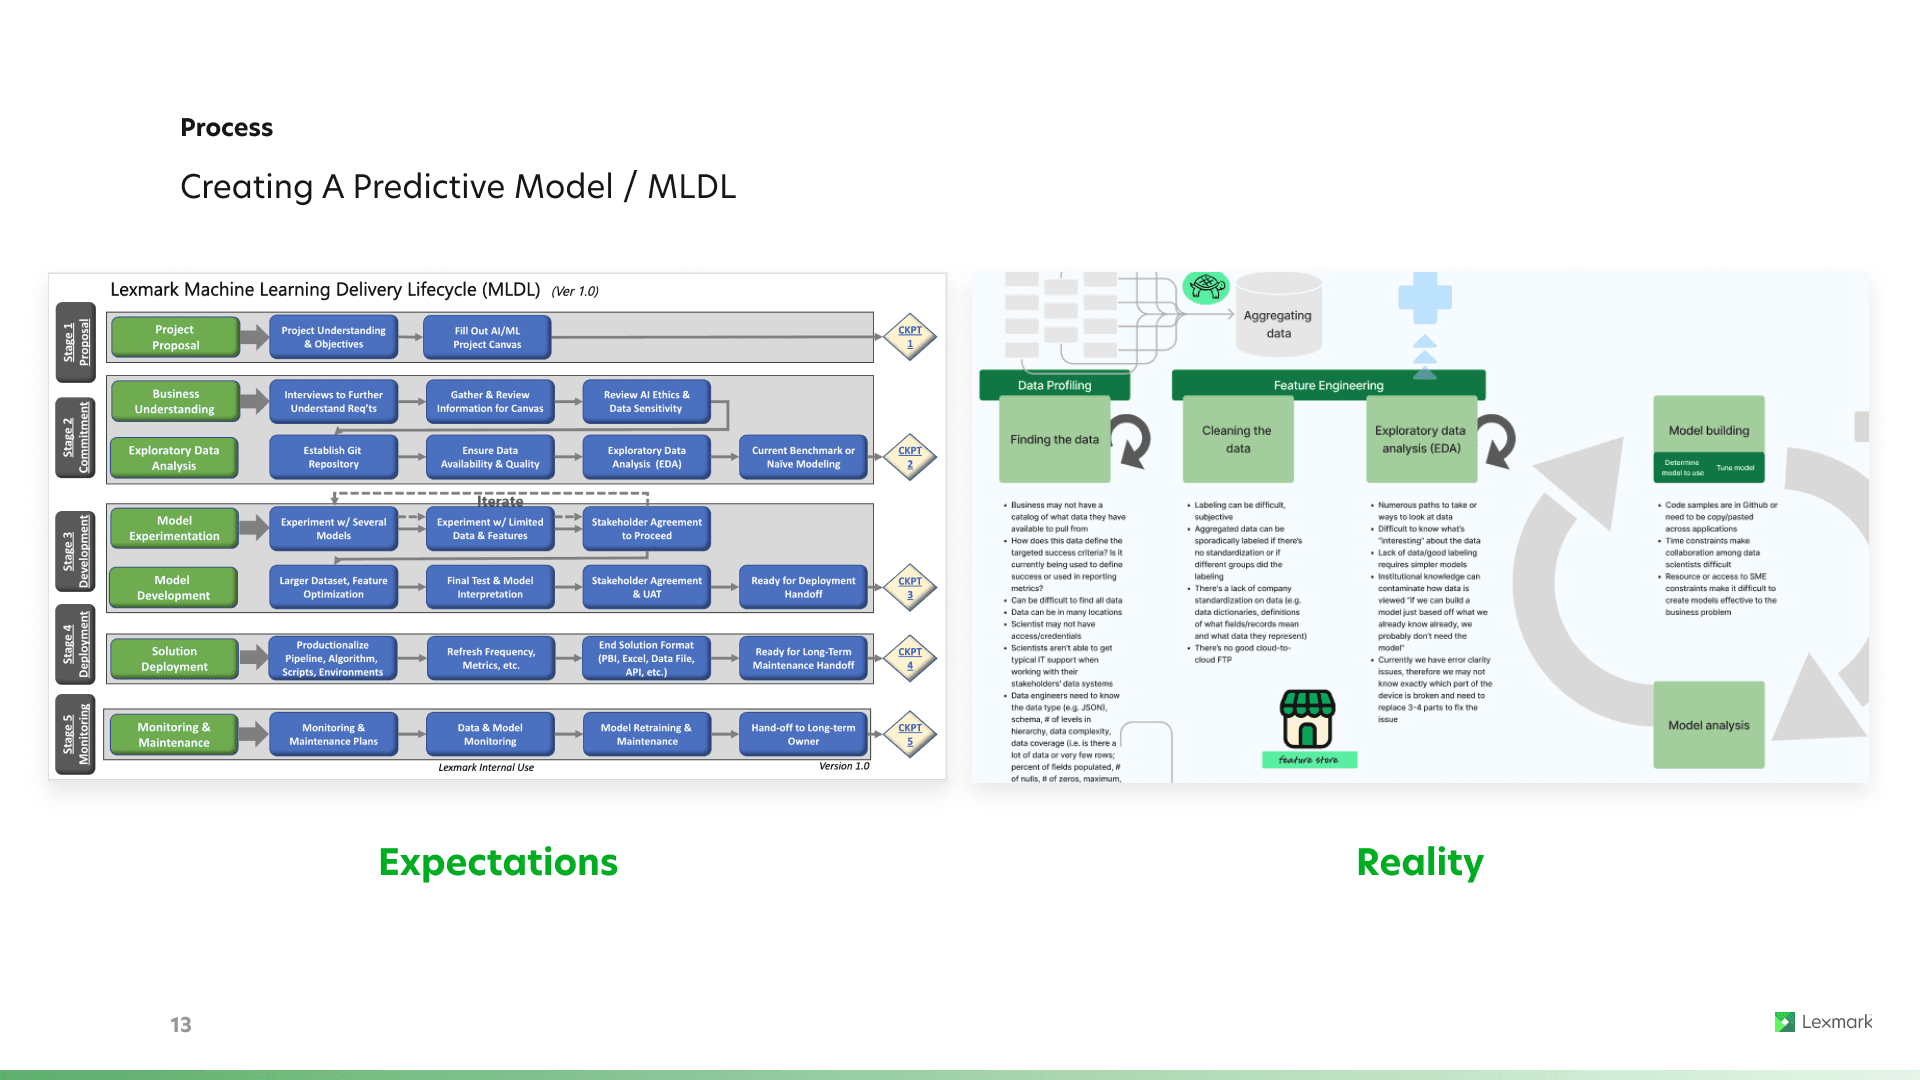
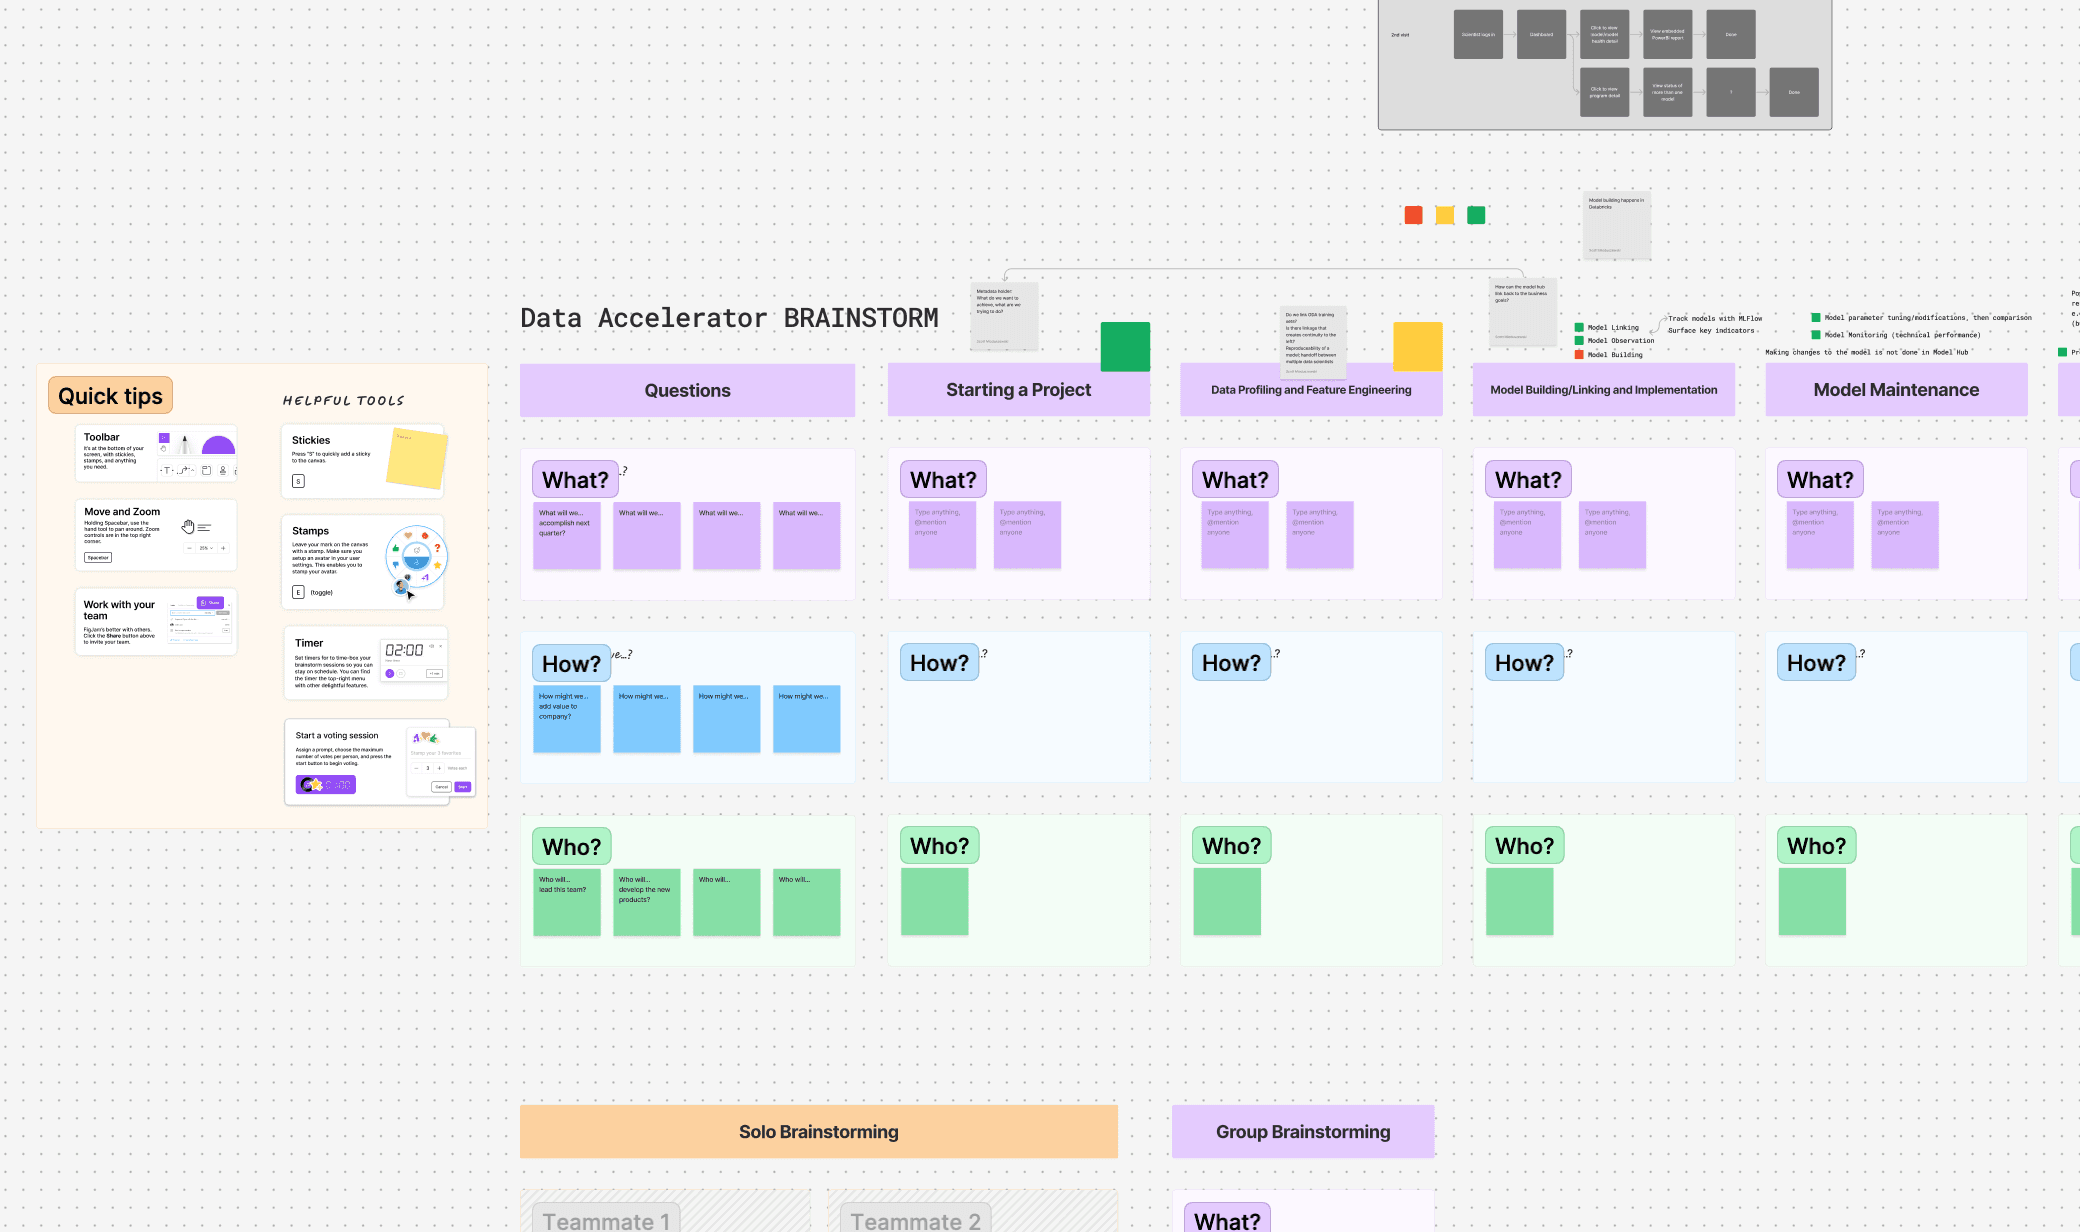
Conducting: I Interviewed 11 data scientists and engineers, and observed 3 using the accelerator.
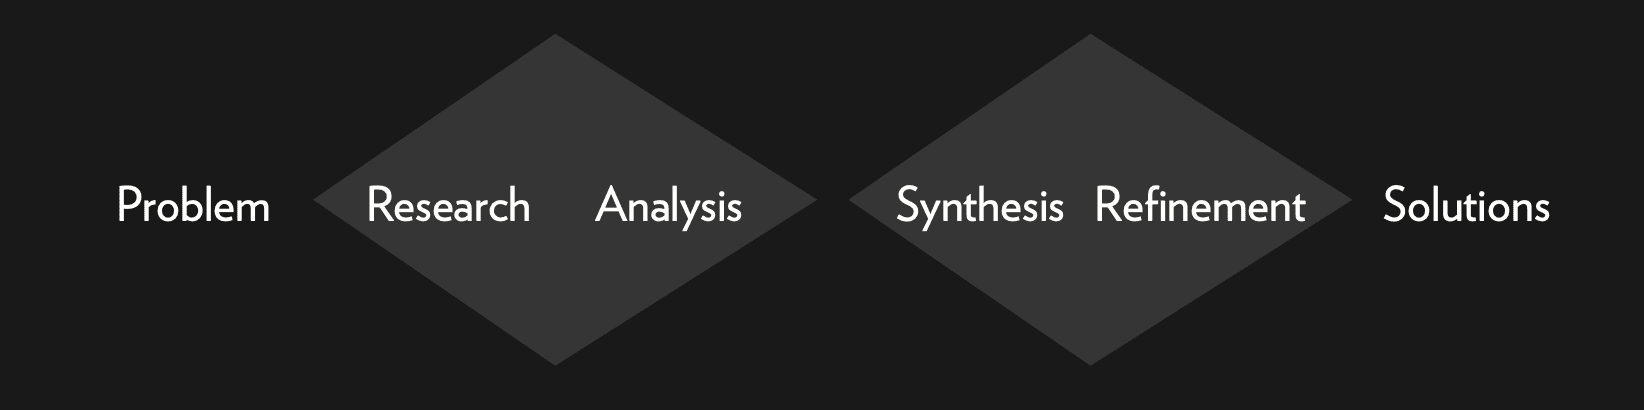
Outcomes/Synthesis: Observations were distilled into insights, then mapped to the overall data lifecycle. This process map helped us focus on the specific area ODA should target, while revealing other challenges that weren't covered in the stakeholder interviews but are still crucial to the users. For example, when scientists are creating models that are used with the data, they currently have no way to associate what they're working on to the business goals the model is trying to solve. This causes problems down the road when working on specific business initiatives and creating baseline and key performance indicators for overall improvement.
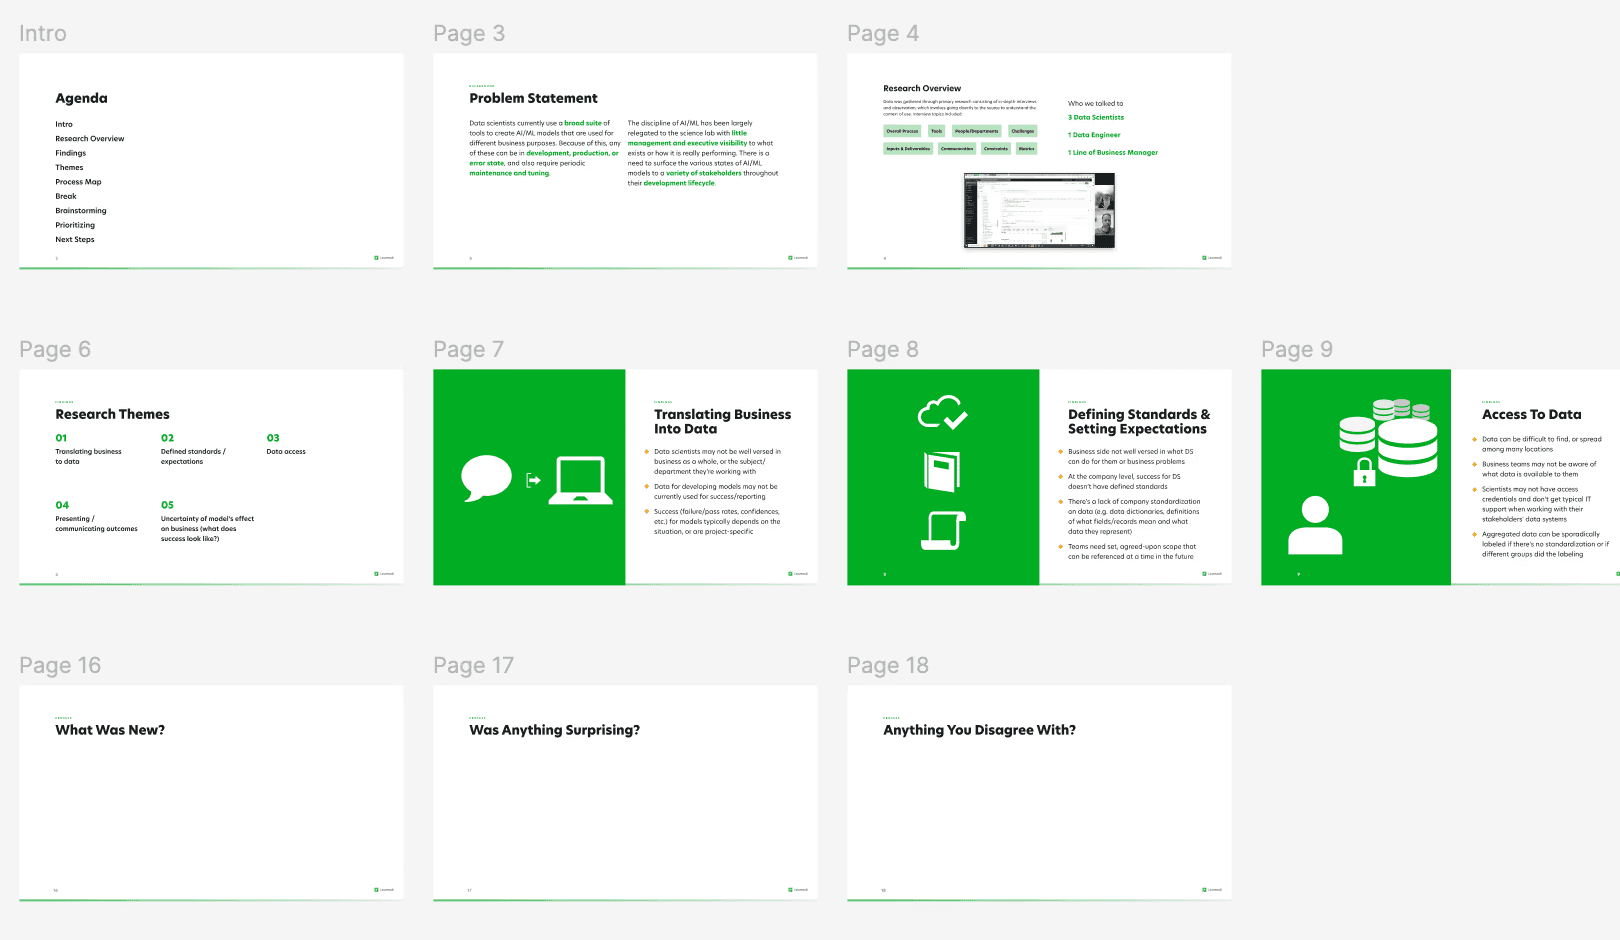
Research Findings Workshop
Are We Focusing On What Really Matters?
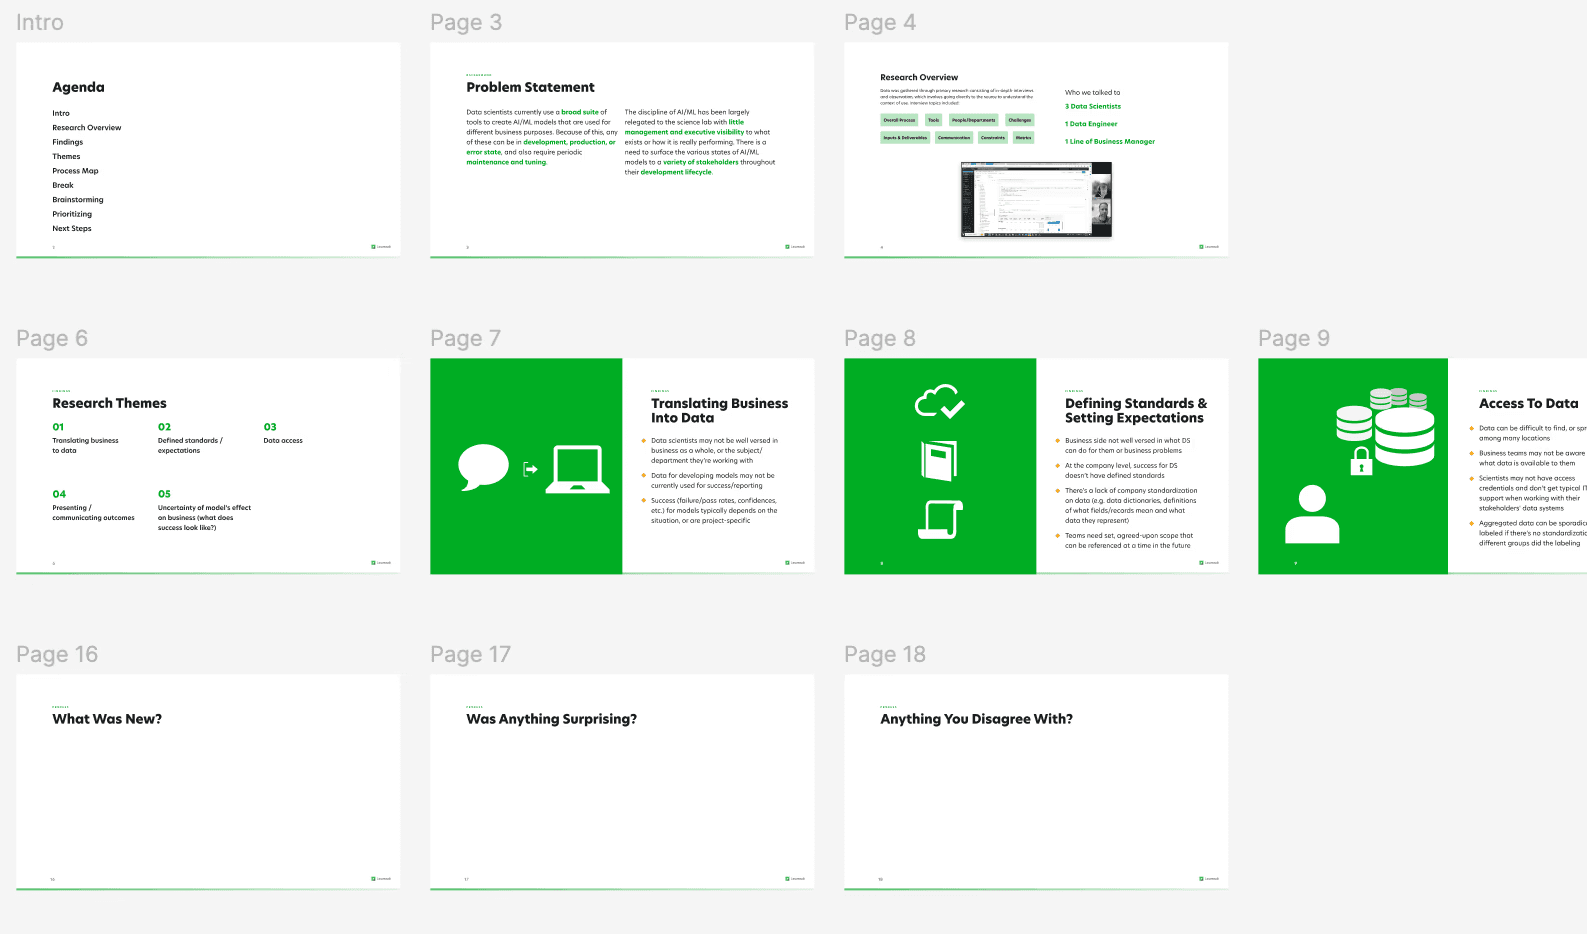
Findings from research were presented in a half day workshop where stakeholders could learn about our users and align on next steps.
During the workshop I facilitated a prioritization exercise where we went through the process map and ranked yes/no/maybe (green/red/yellow) the areas the product owners wanted to focus on moving forward, or calling out specifically what features the ODA would not address.
Research Findings Workshop
Are We Focusing On What Really Matters?
Findings from research were presented in a half day workshop where stakeholders could learn about our users and align on next steps.
During the workshop I facilitated a prioritization exercise where we went through the process map and ranked yes/no/maybe (green/red/yellow) the areas the product owners wanted to focus on moving forward, or calling out specifically what features the ODA would not address.
Design
Creating Intuitive Workflows
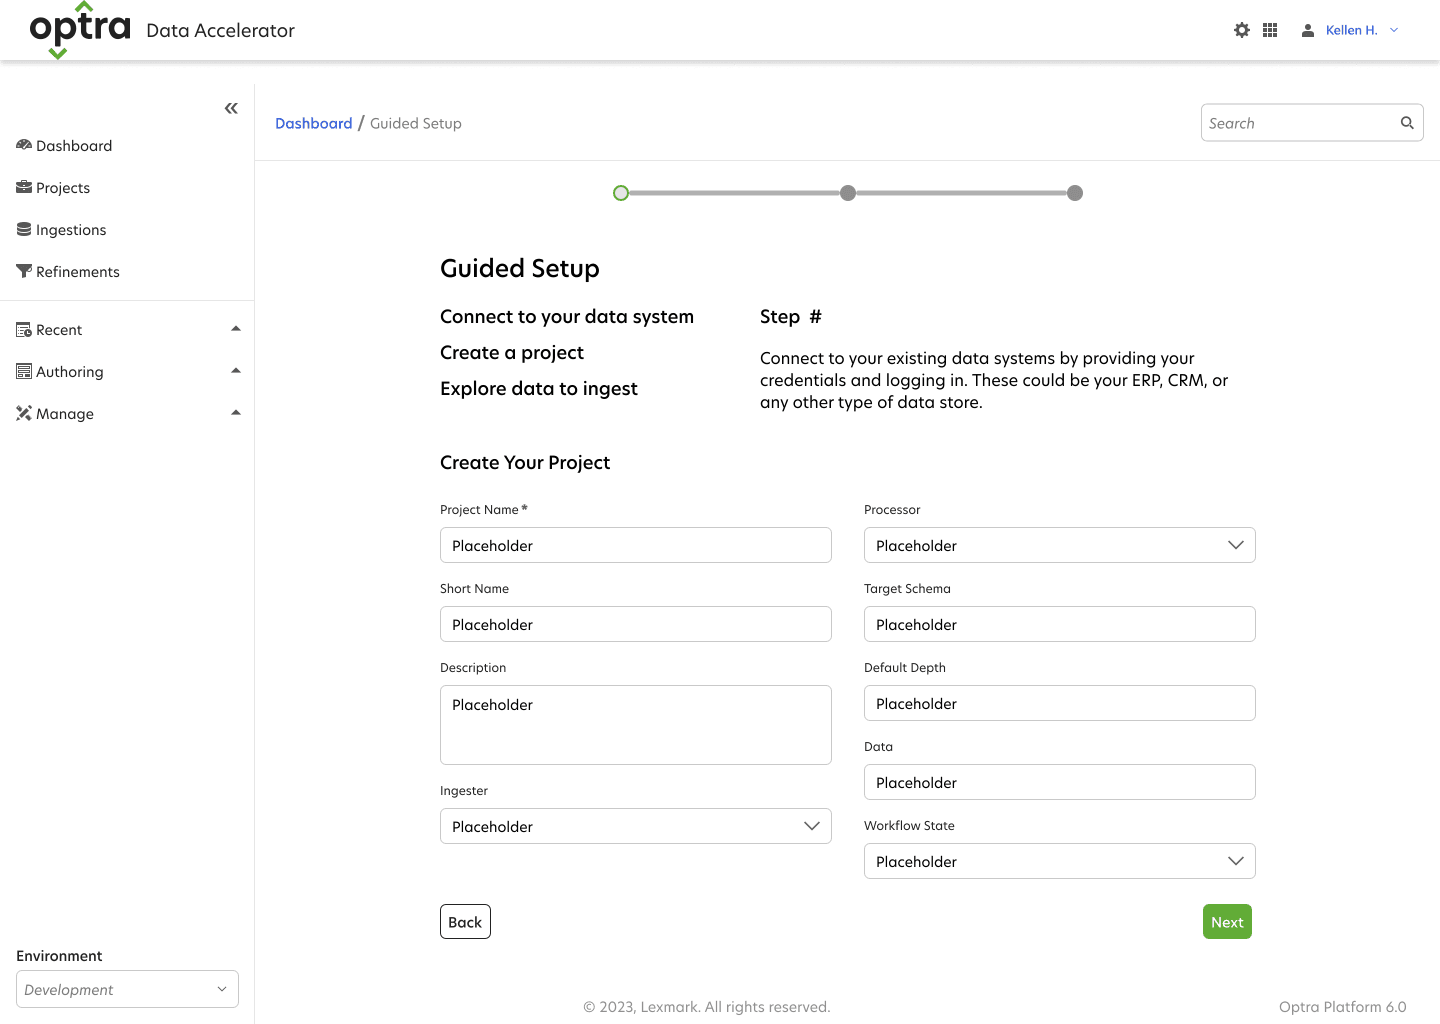
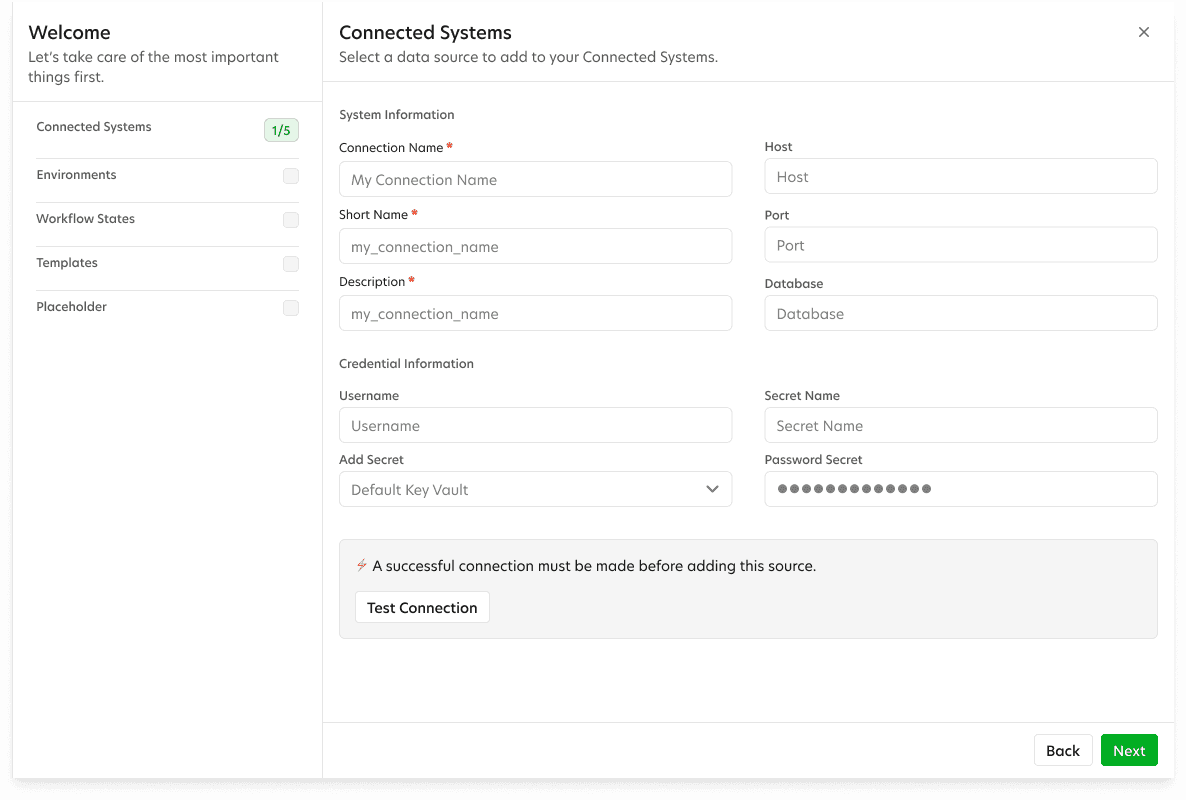
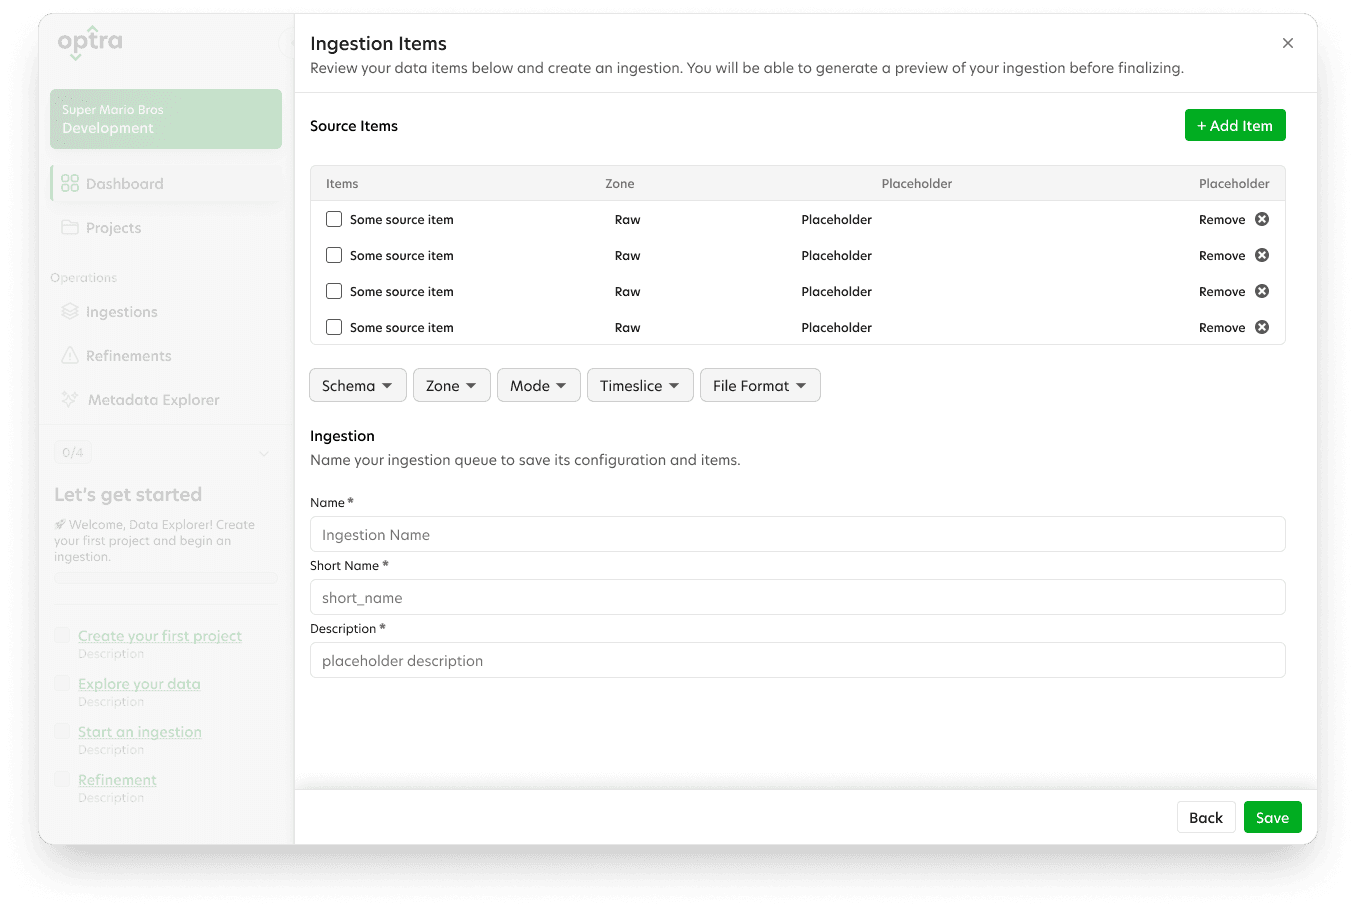
After creating a high level map of the process, I began creating workflows that users would need to follow to accomplish their tasks. This allowed us to iterate and align on the optimal path while reducing data entry fields to a minimum.
Design
Creating Intuitive Workflows
After creating a high level map of the process, I began creating workflows that users would need to follow to accomplish their tasks. This allowed us to iterate and align on the optimal path while reducing data entry fields to a minimum.
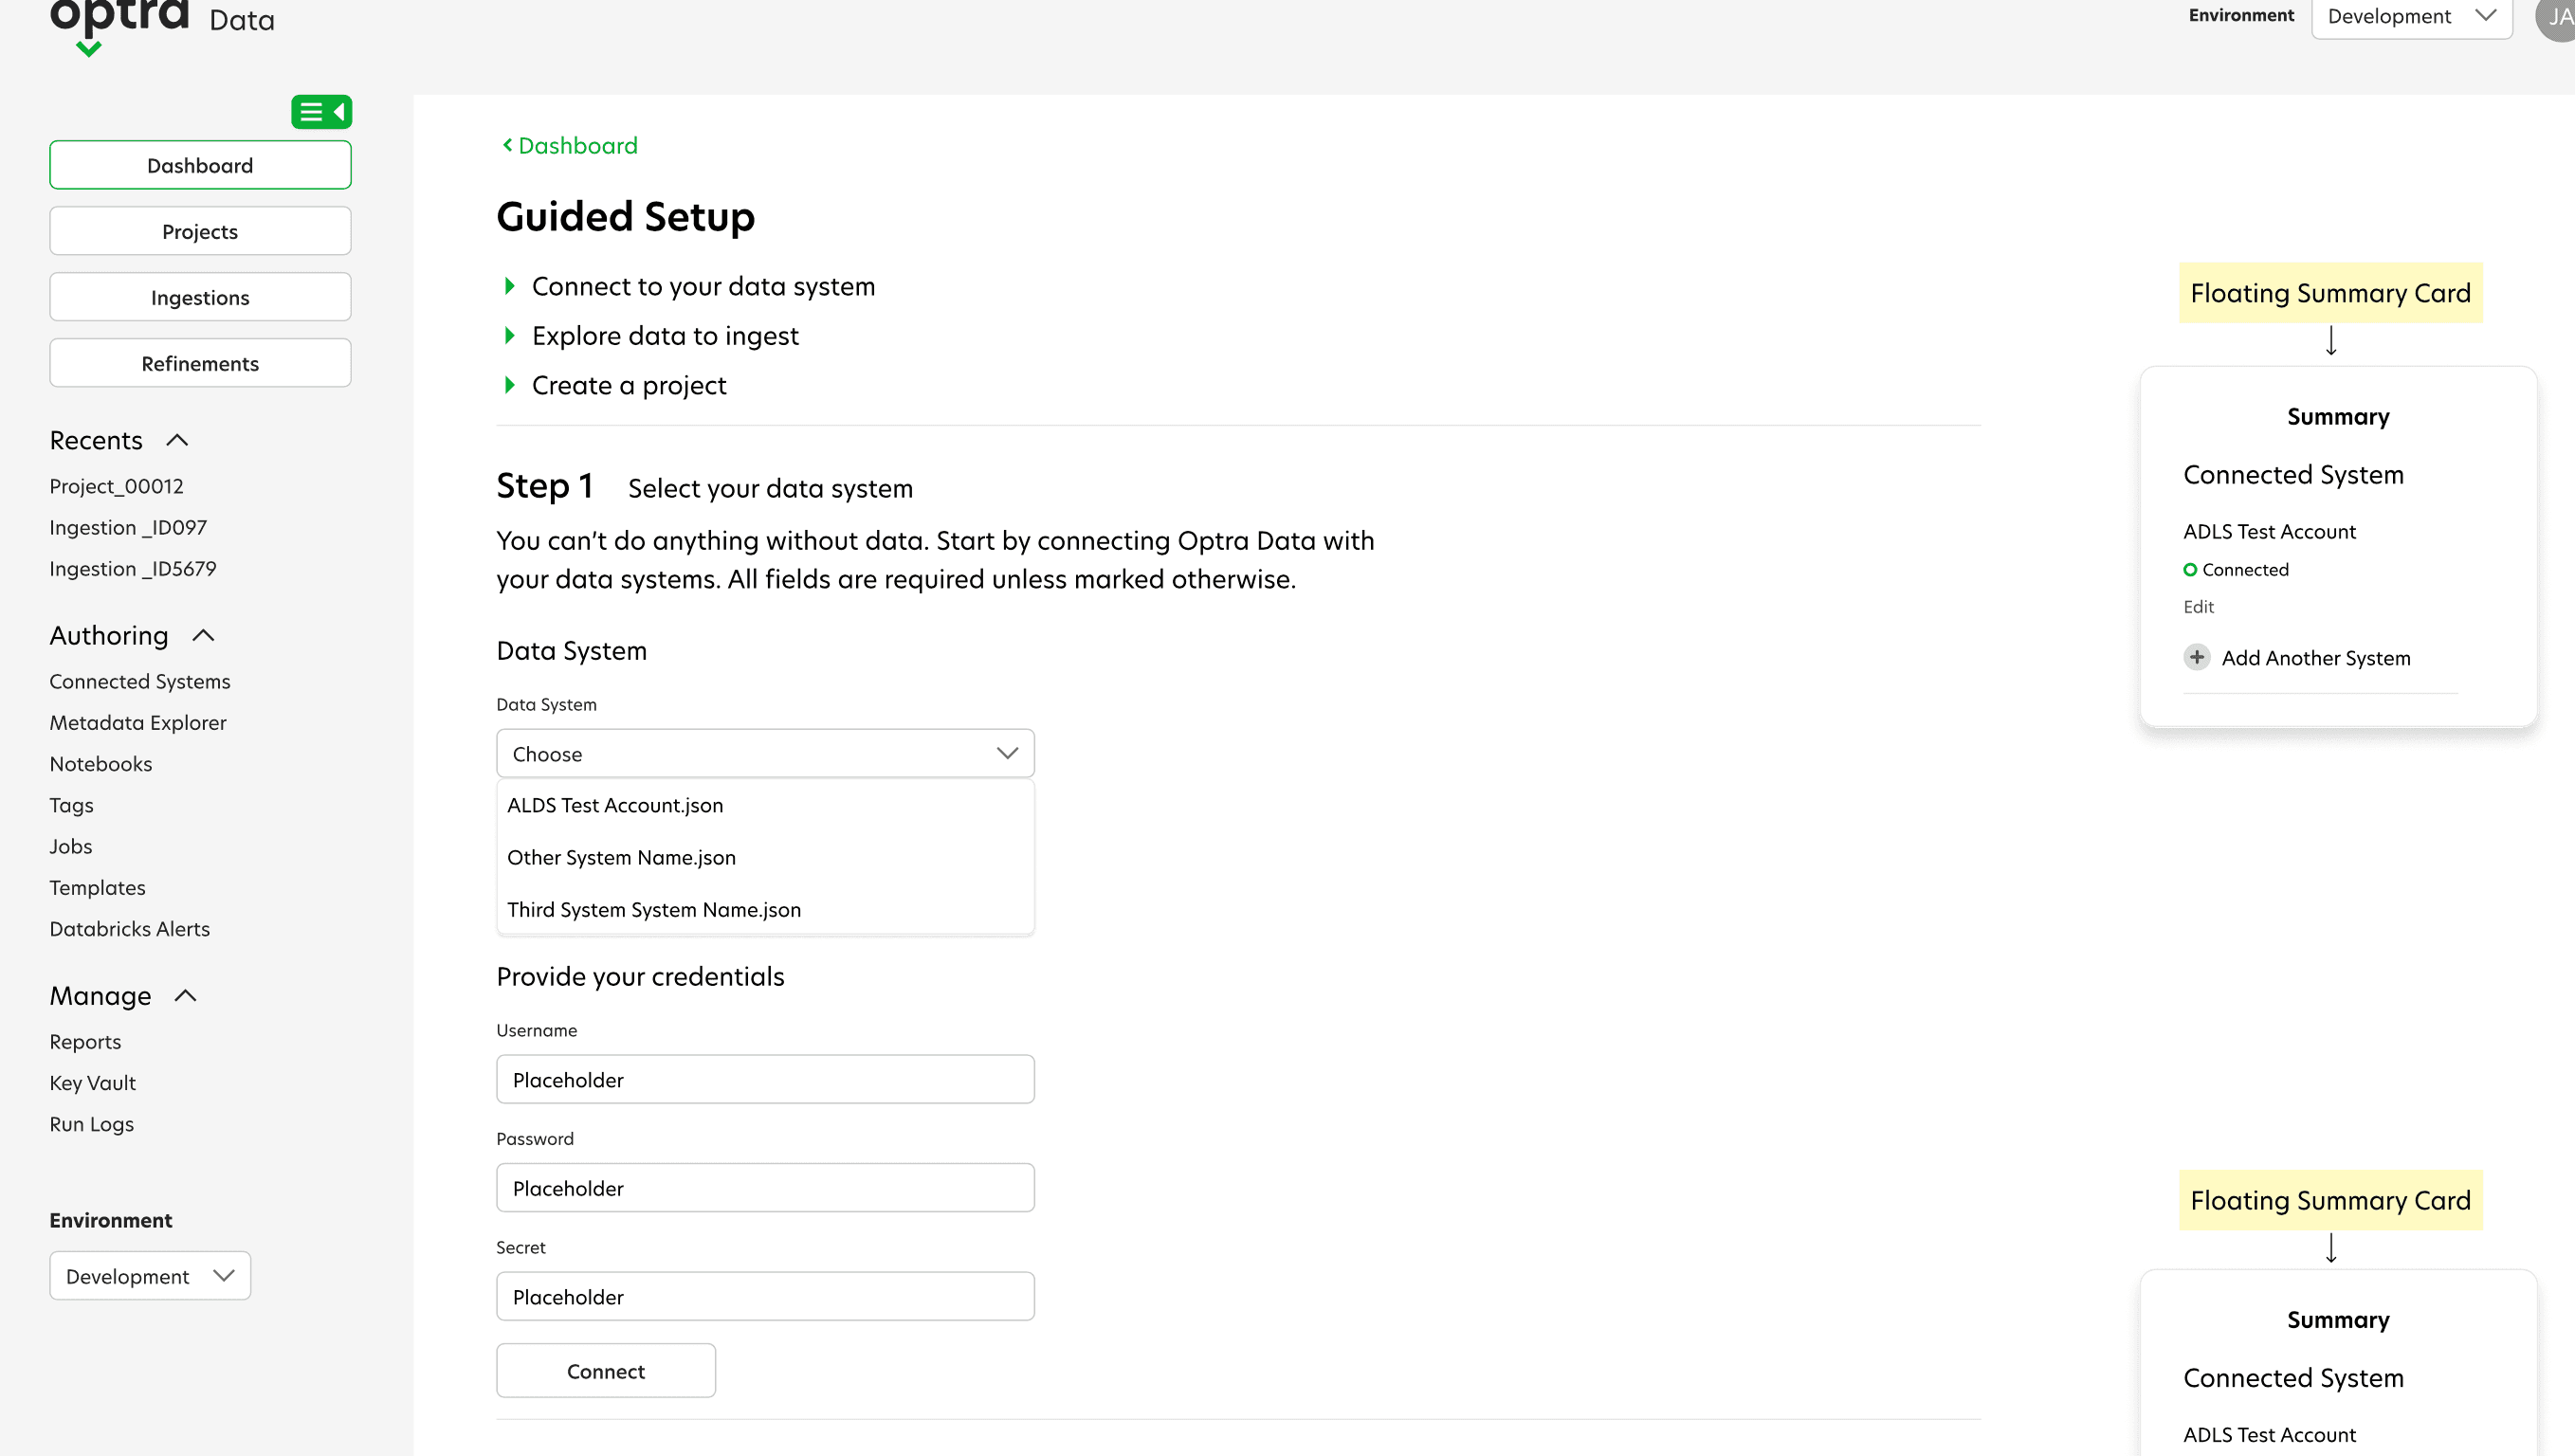
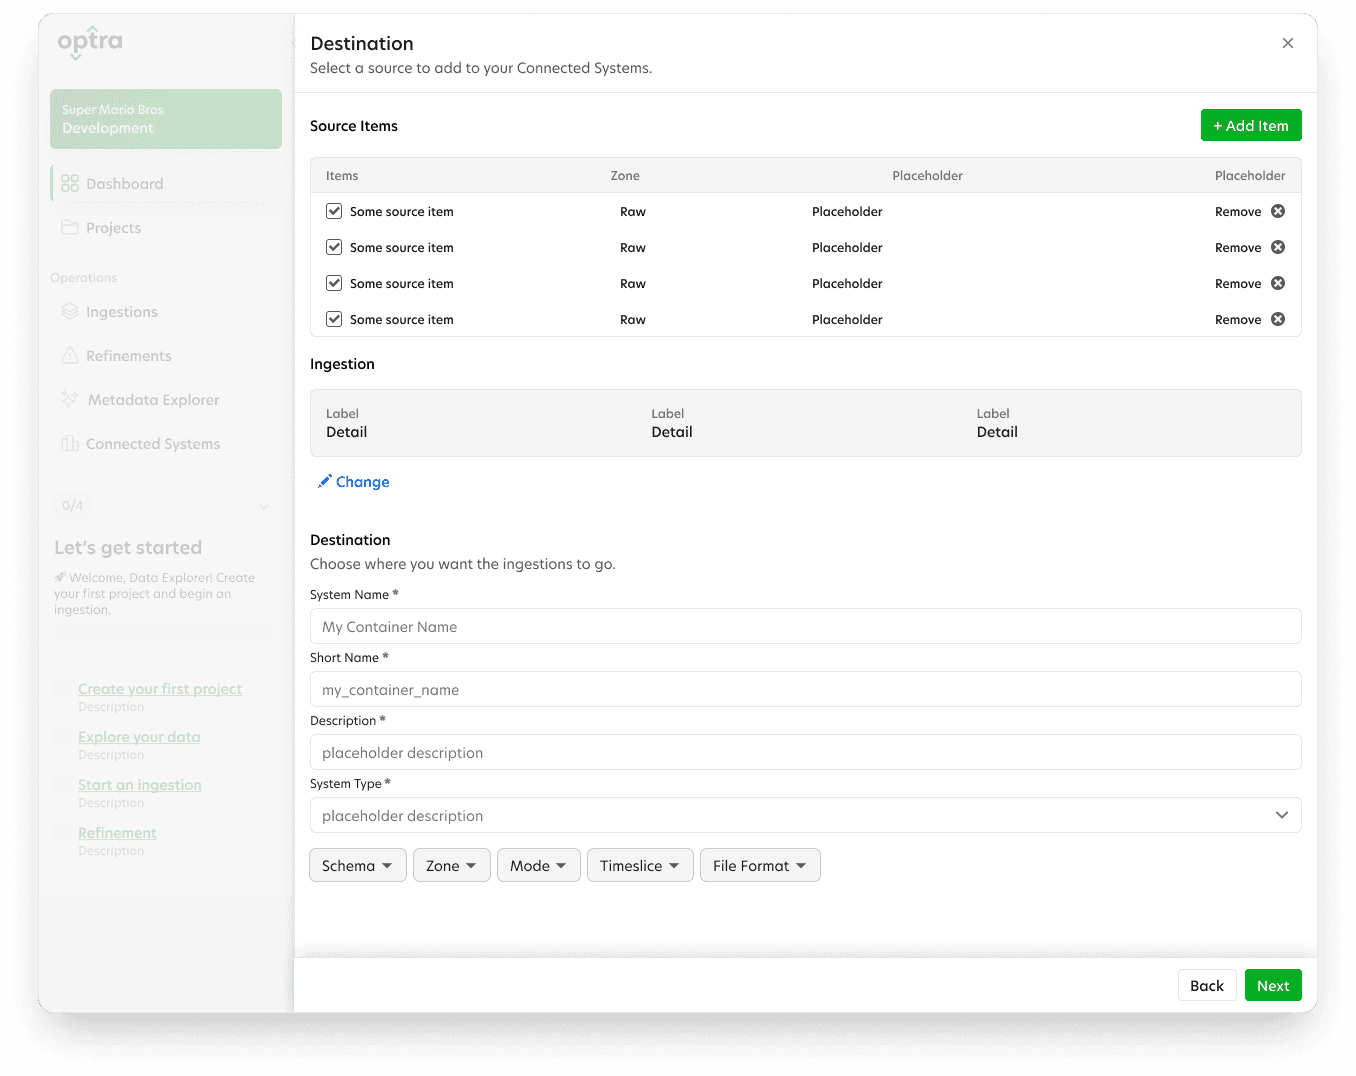
My key victory was separating the data system setup from the ingestion and refinement process. This allowed us shift some responsibility from the data engineer to the administrator when initializing their org. This sped up the process and reduced the pain point of having to hunt down access credentials in the middle of setup.
This was a way to represent the different problems AI would be trying to solve. One can answer any question or calculate the probabilities of multiple scenarios, while the other doesn’t speak but you trust it to fly your star-fighter or deliver your most important messages.

Getting Organized With An App Map
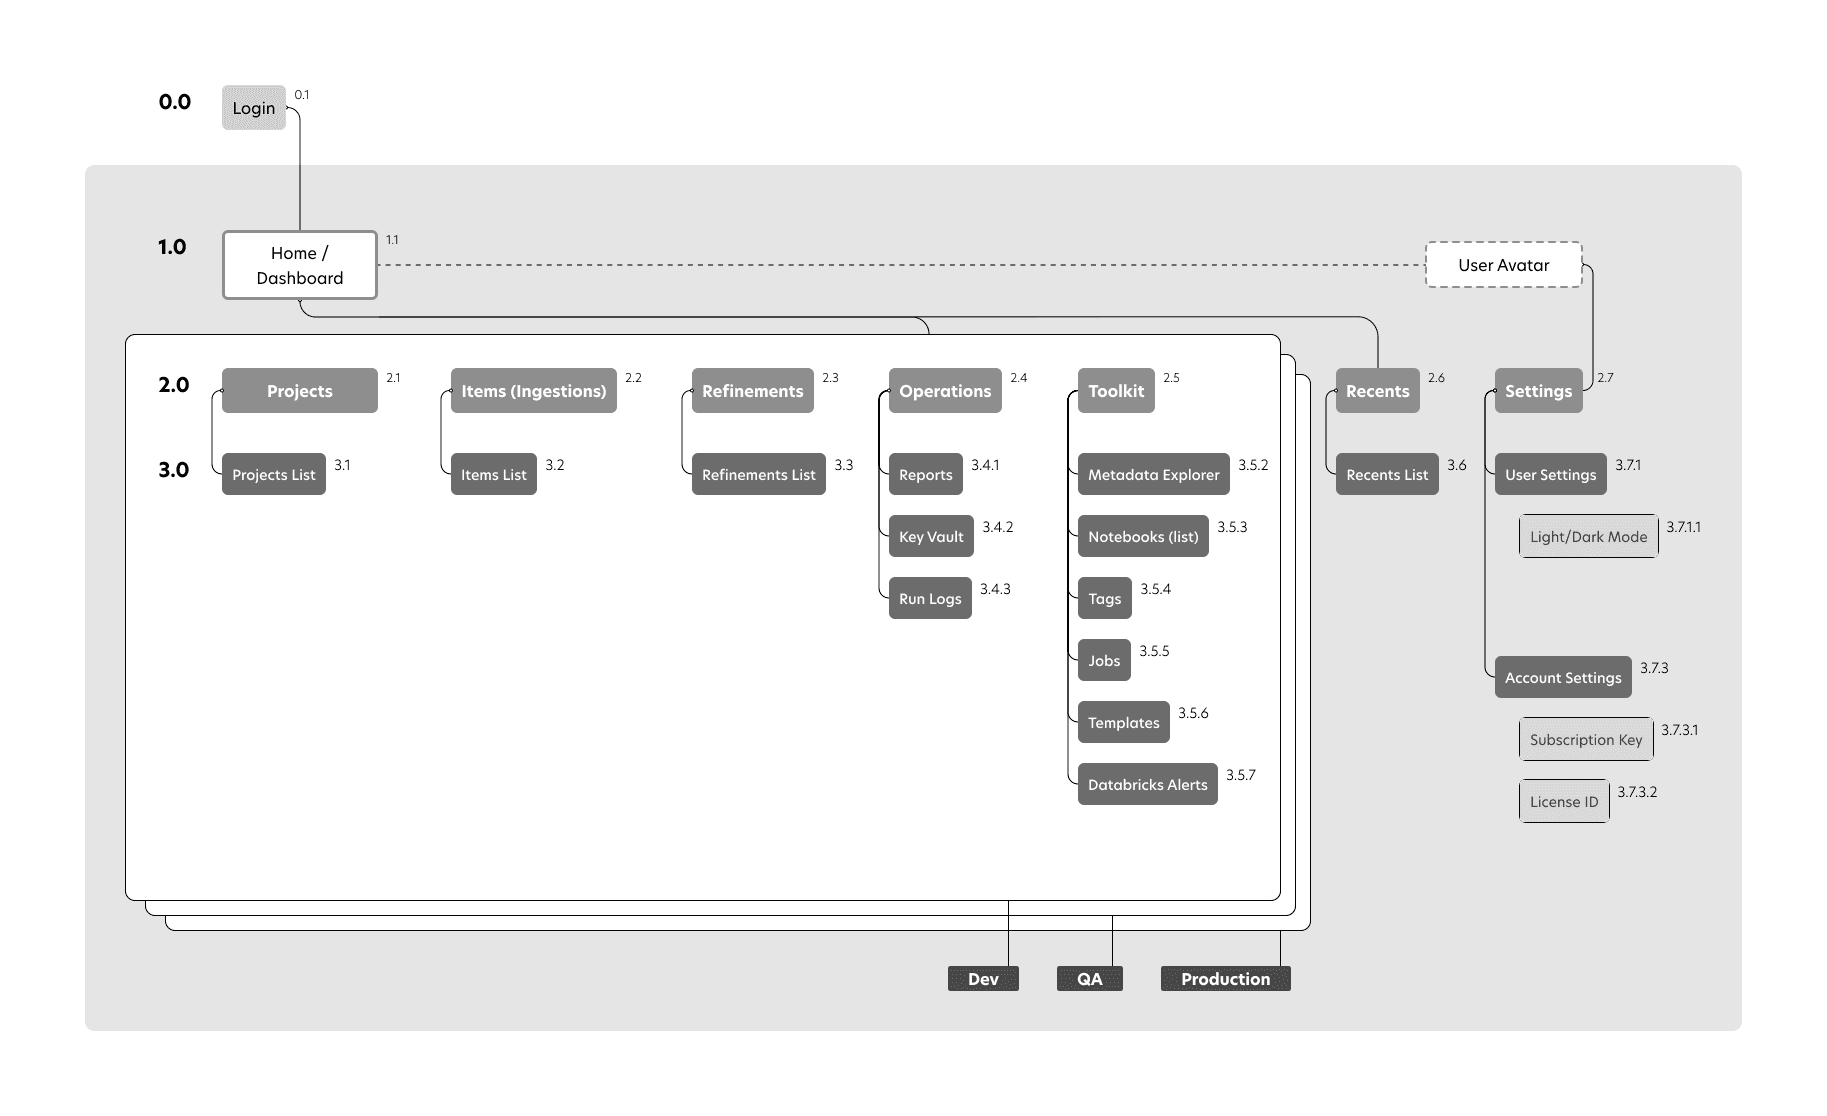
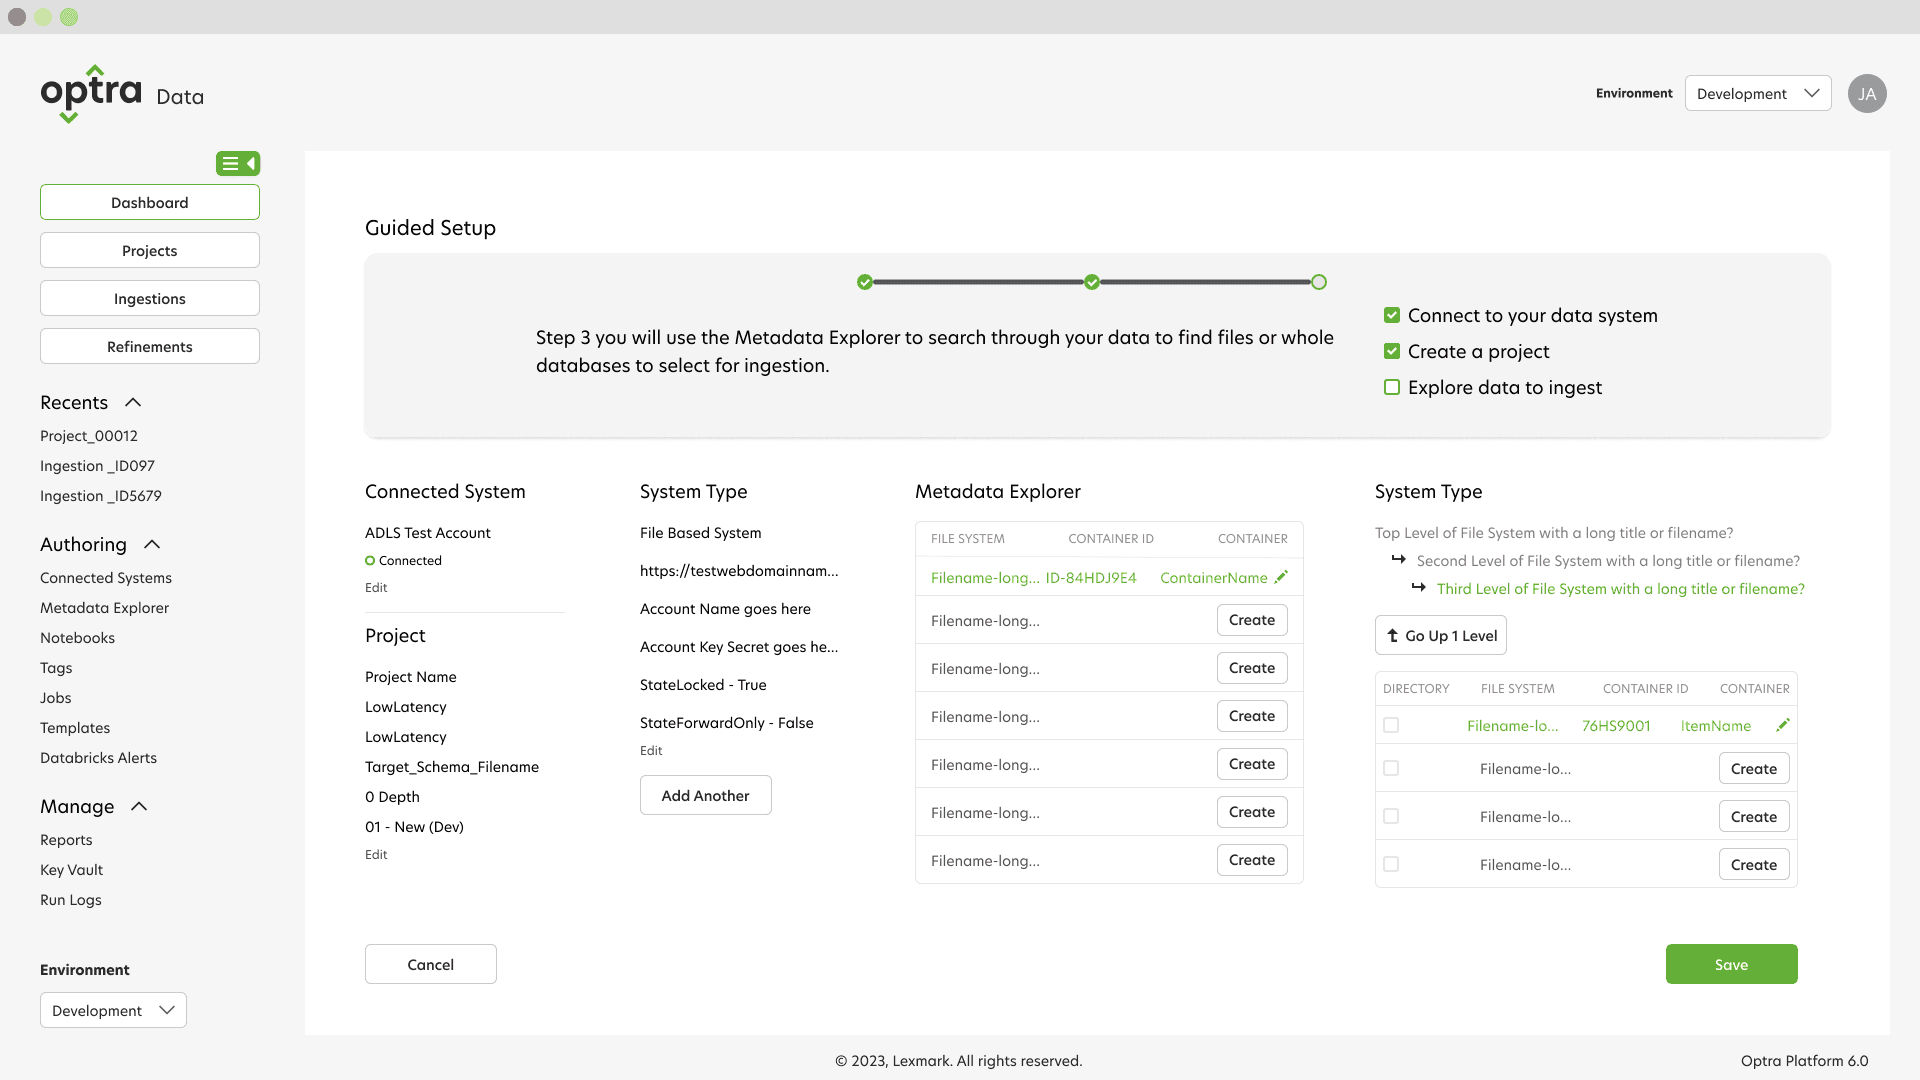
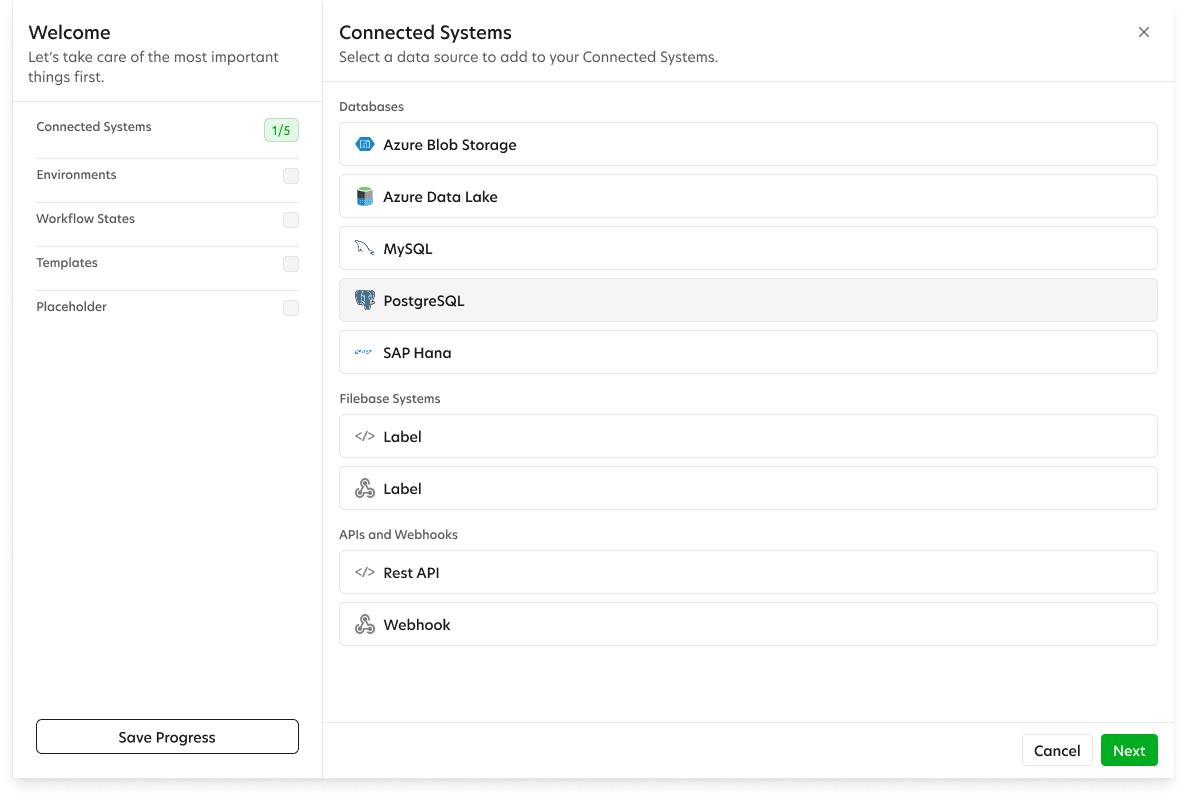
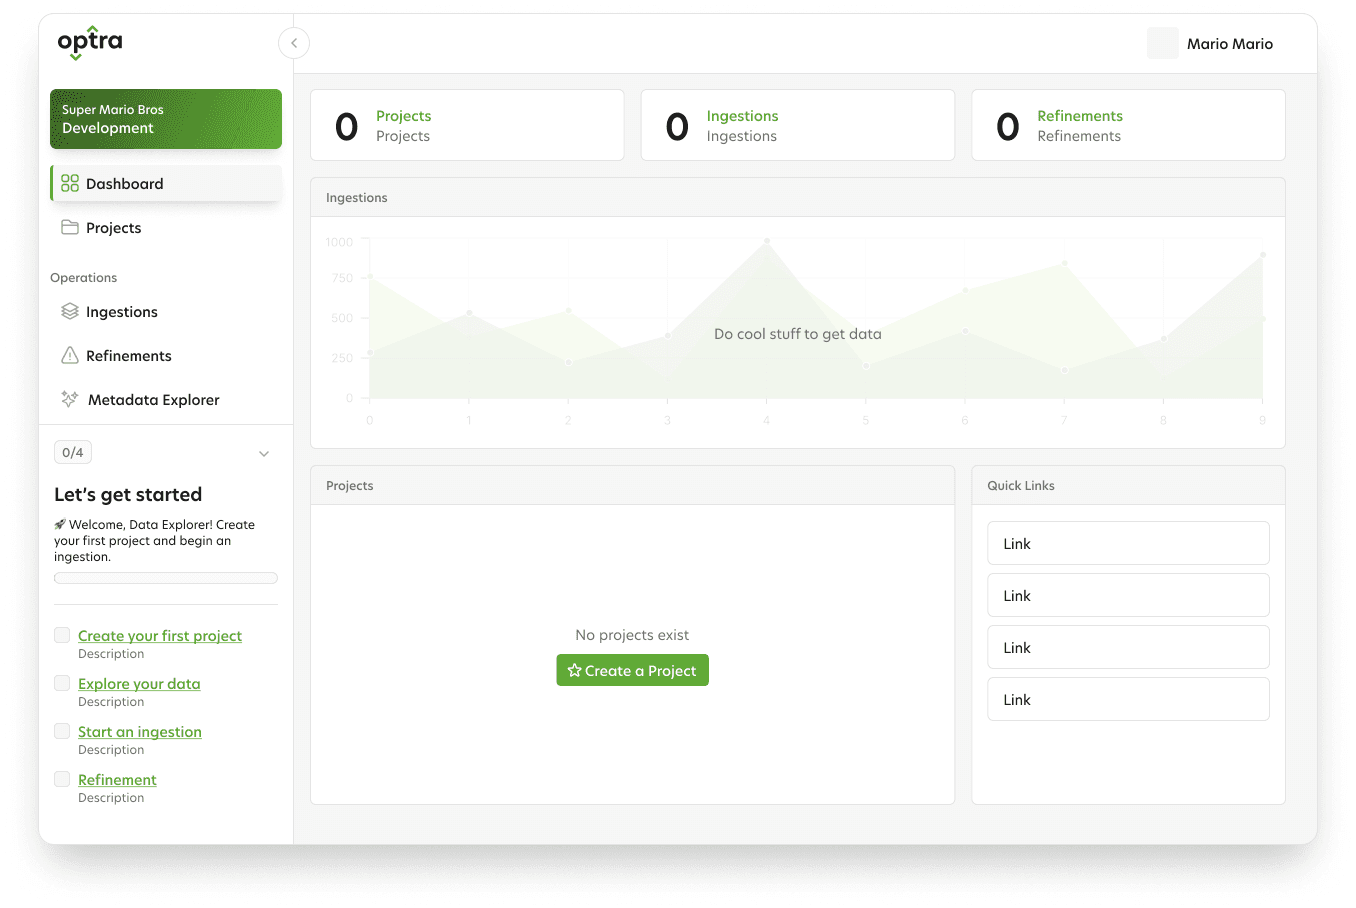
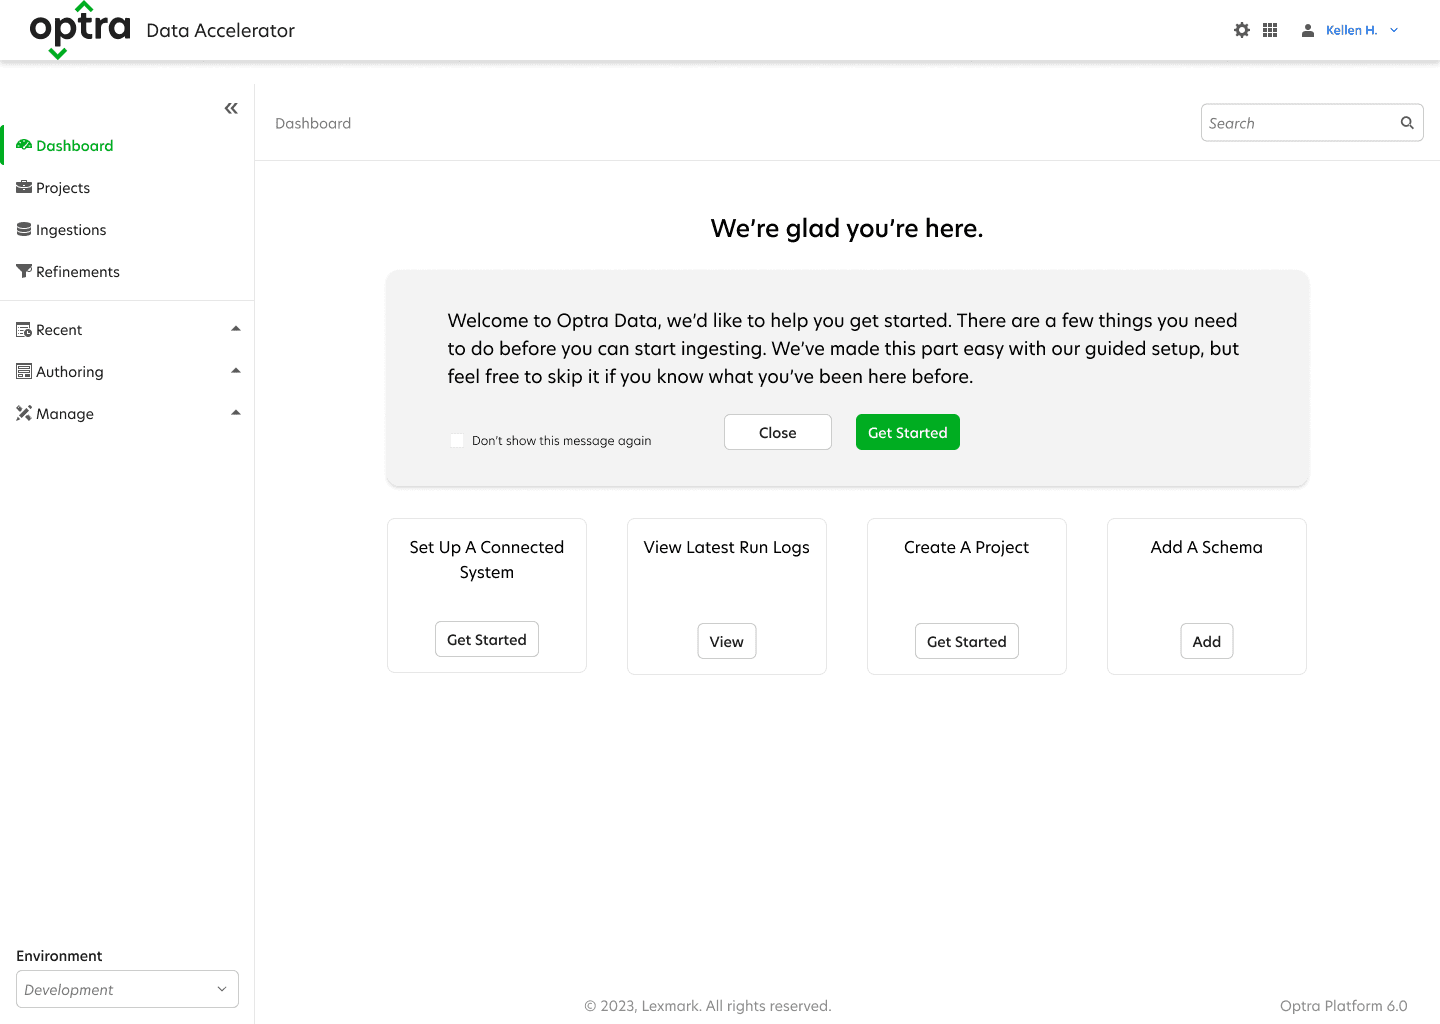
ODA also needed a structural makeover. The POC was made for the original developer, with dozens of fields exposed that were not applicable for end users. This was a good time to clean house by transitioning to a modern app structure. This was done by creating dedicated project sections that would house their own ingestions and refinements.
Another major change was creating a section for all the data connections to live. This removed the process of adding connections each ingestion.
Getting Organized With An App Map
ODA also needed a structural makeover. The POC was made for the original developer, with dozens of fields exposed that were not applicable for end users. This was a good time to clean house by transitioning to a modern app structure. This was done by creating dedicated project sections that would house their own ingestions and refinements.
Another major change was creating a section for all the data connections to live. This removed the process of adding connections each ingestion.
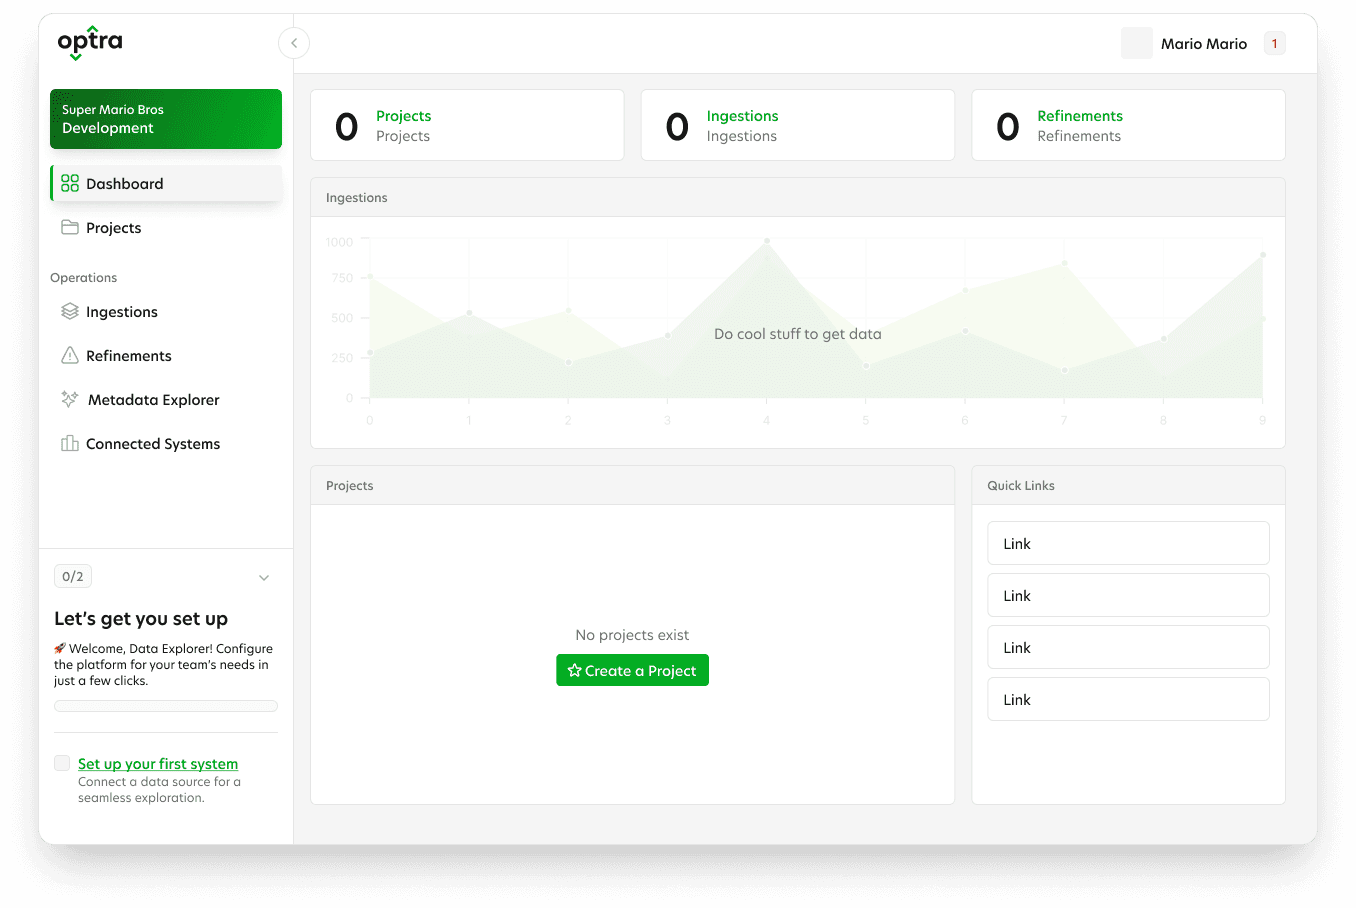
Visualizing Options Using Wireframes
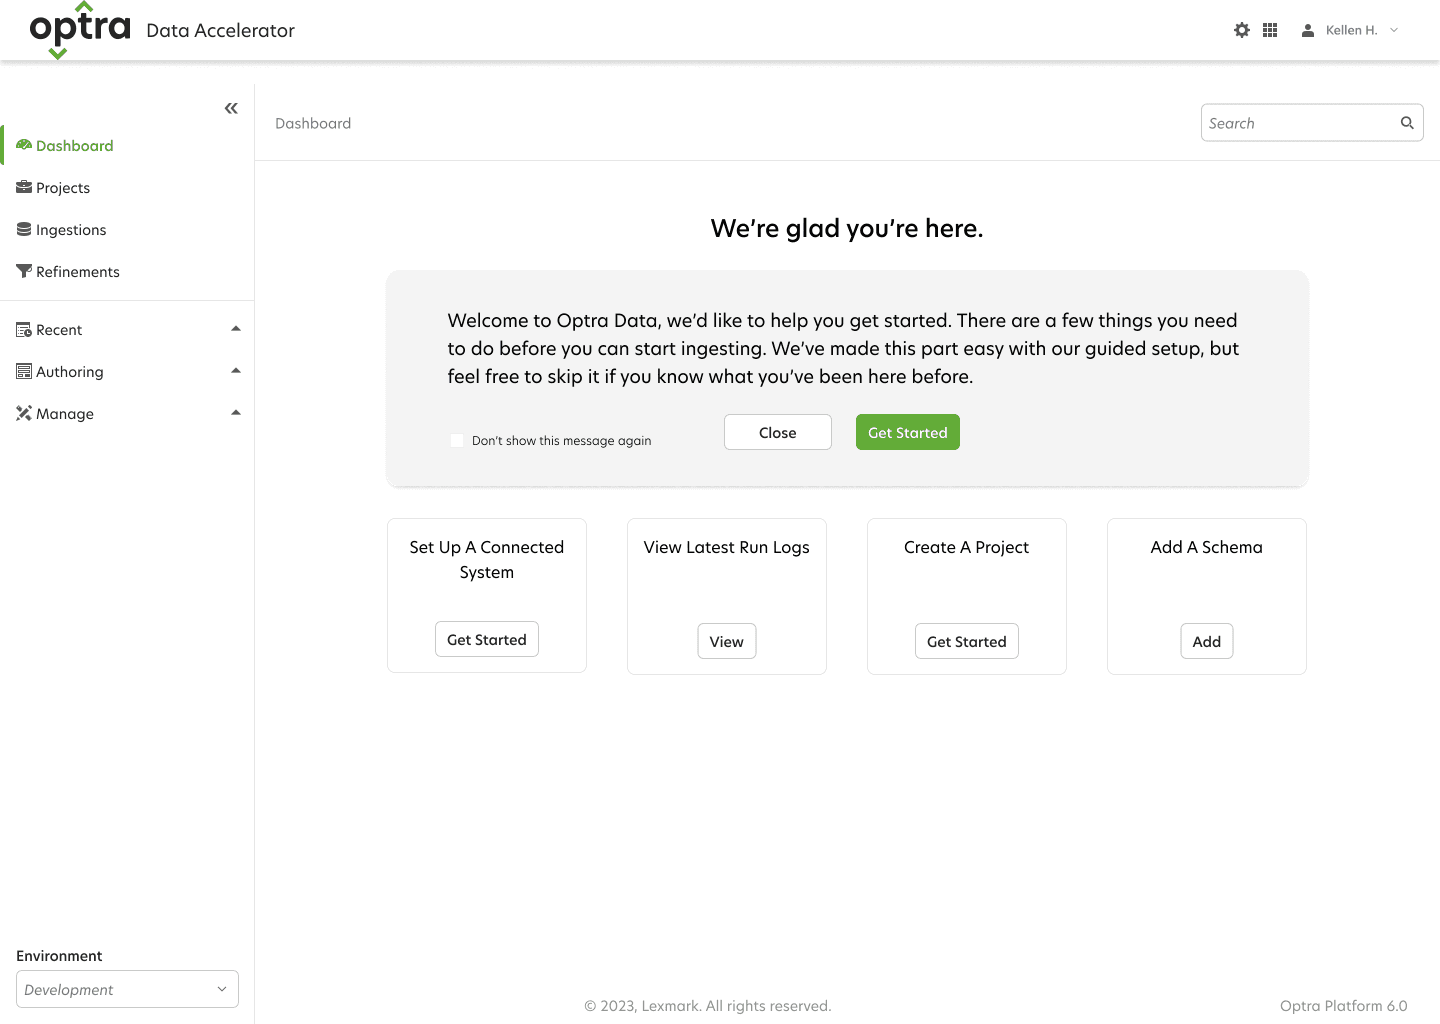
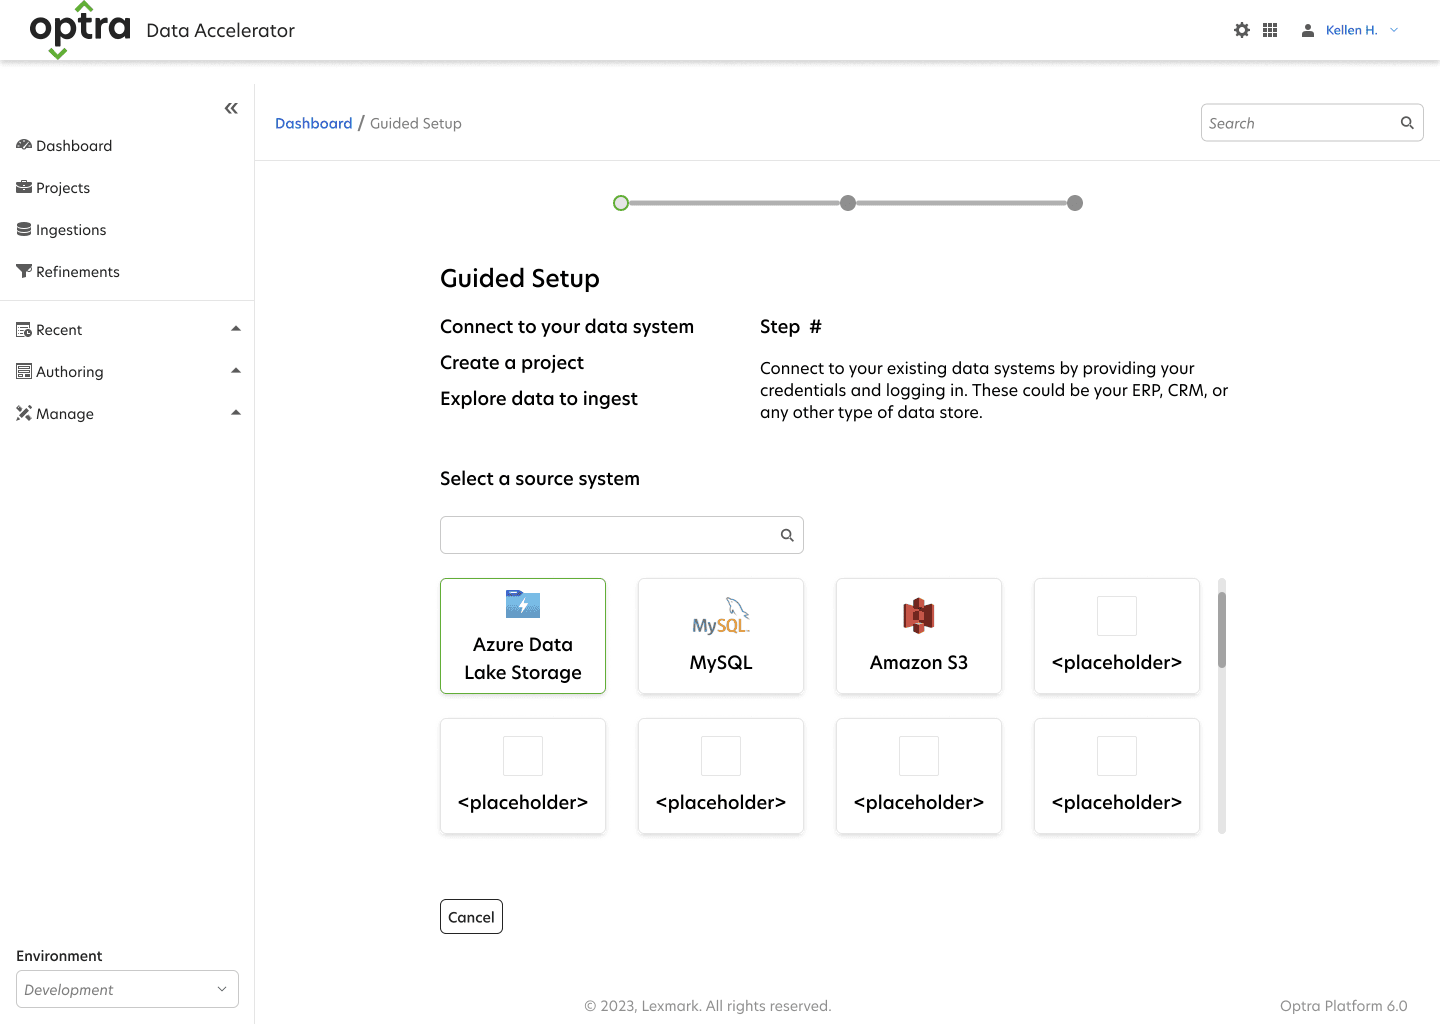
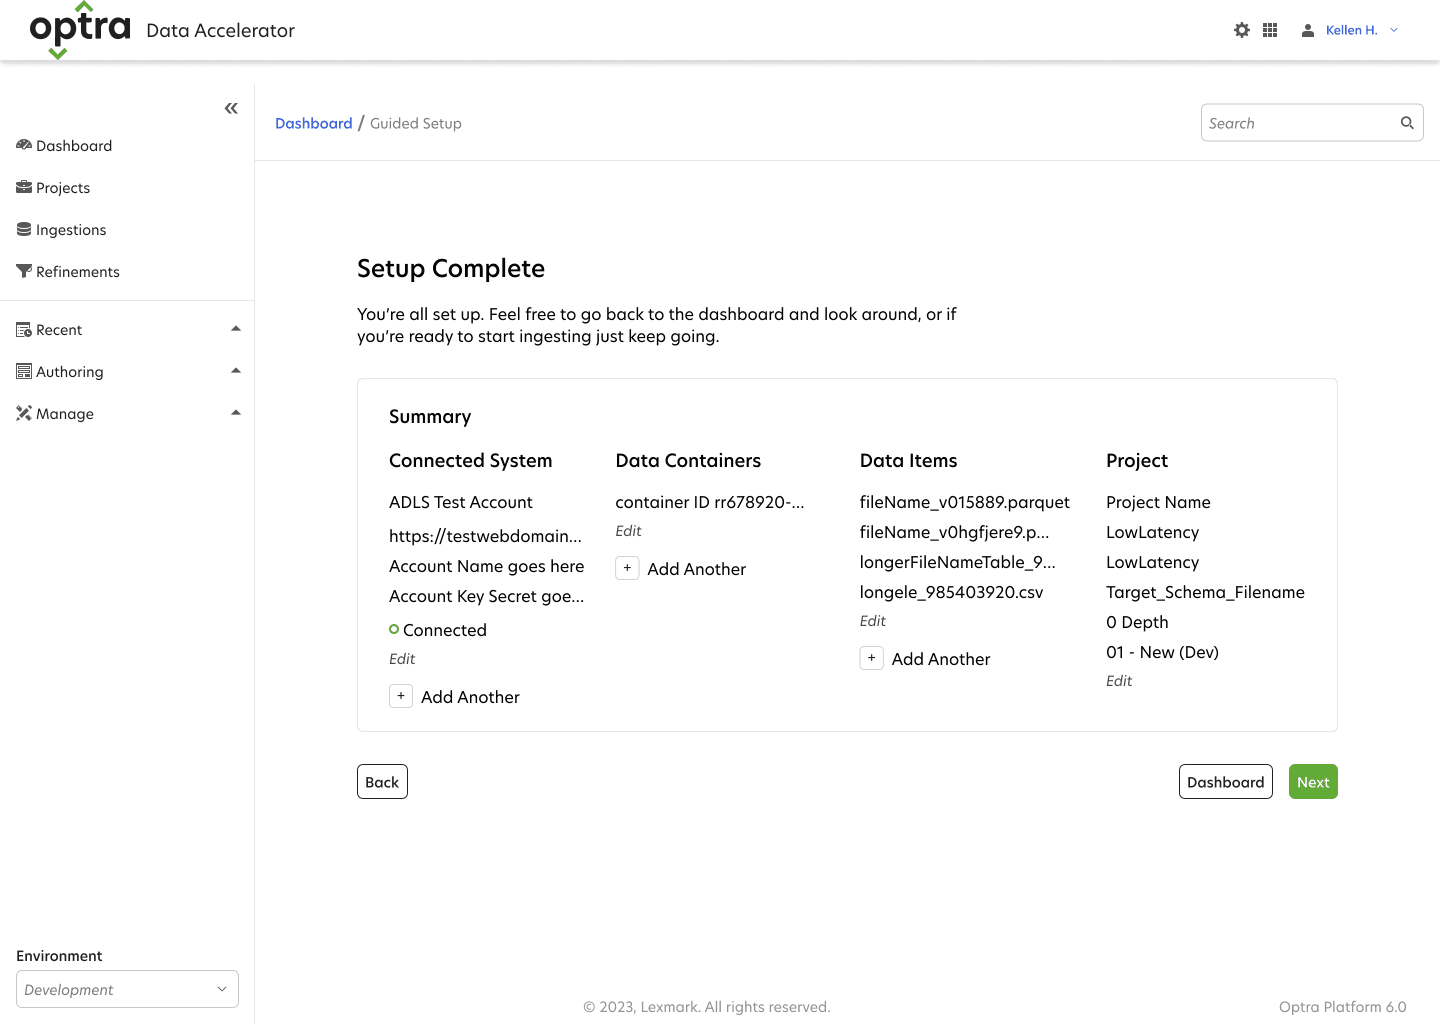
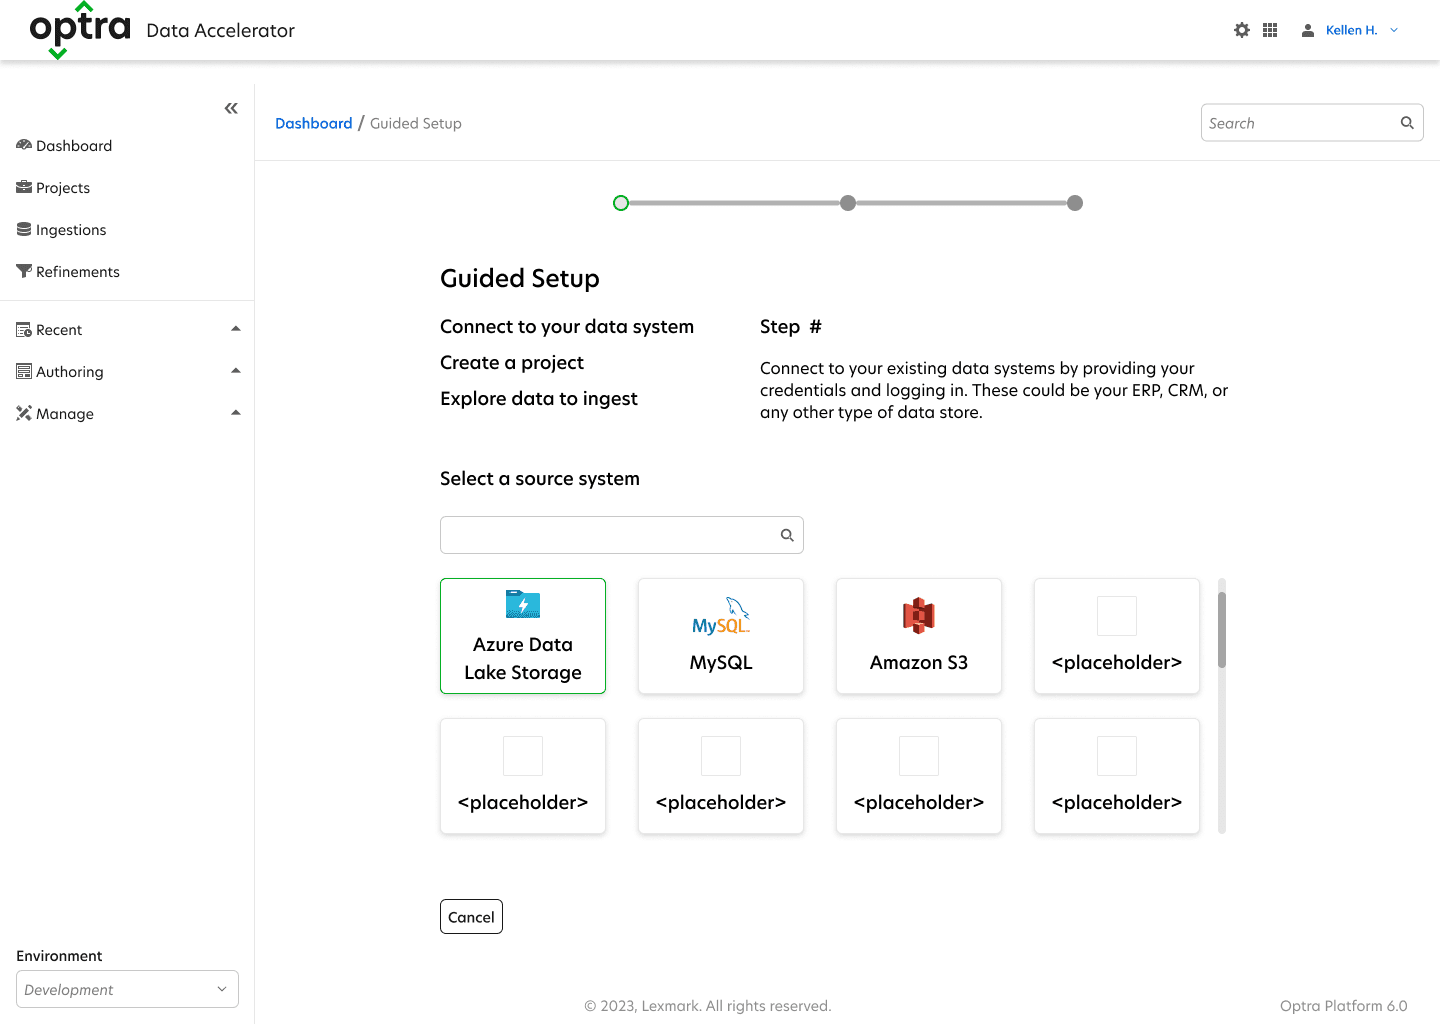
With the goal of getting users onboarded and realizing value quickly, I began designing an improved onboarding process and guided tour. Designing the workflow around the data the scientist wanted to capture, instead of spending time getting API access to their databases, cut the setup time in half—an enormous improvement .
Visualizing Options Using Wireframes
With the goal of getting users onboarded and realizing value quickly, I began designing an improved onboarding process and guided tour. Designing the workflow around the data the scientist wanted to capture, instead of spending time getting API access to their databases, cut the setup time in half—an enormous improvement .
Feedback
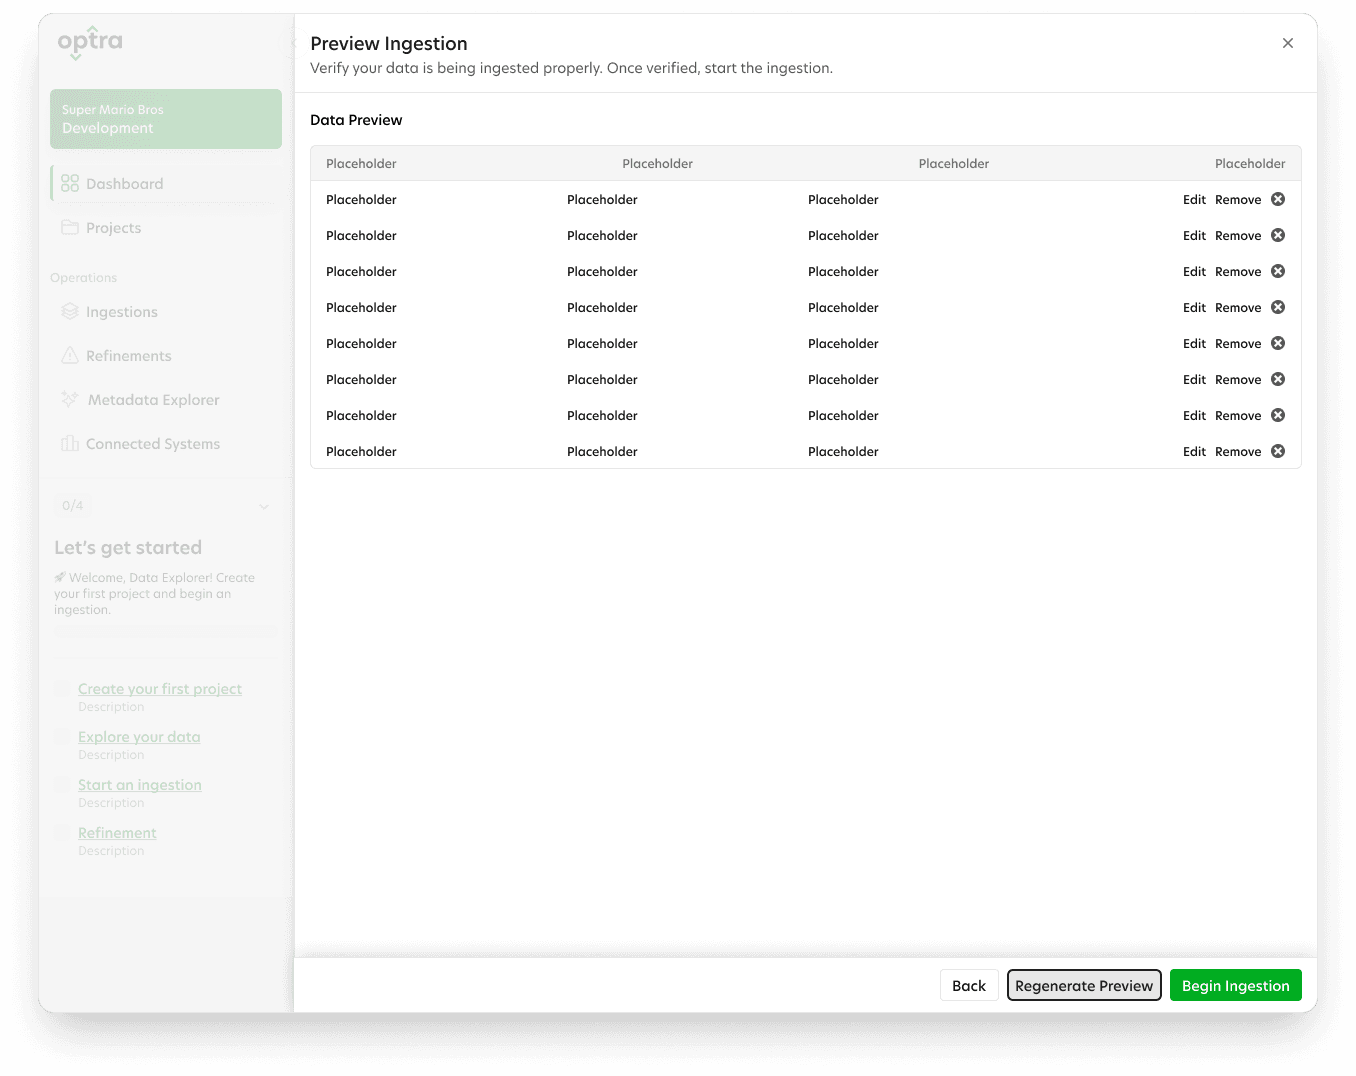
Our short timeline prohibited formal usability tests, but I was still able to present the new experience to users to capture attitudinal feedback about the changes through a series of cognitive walkthroughs.
Goals: Validate the redesigned workflows and UI with real users to ensure alignment with their needs and goals.
Outcome: Feedback showed that the prototype significantly improved task completion time and user satisfaction. The reduction in data entry also decreased the users' perception of complexity of the app so it didn't feel overwhelming.
Refining Based On User Input
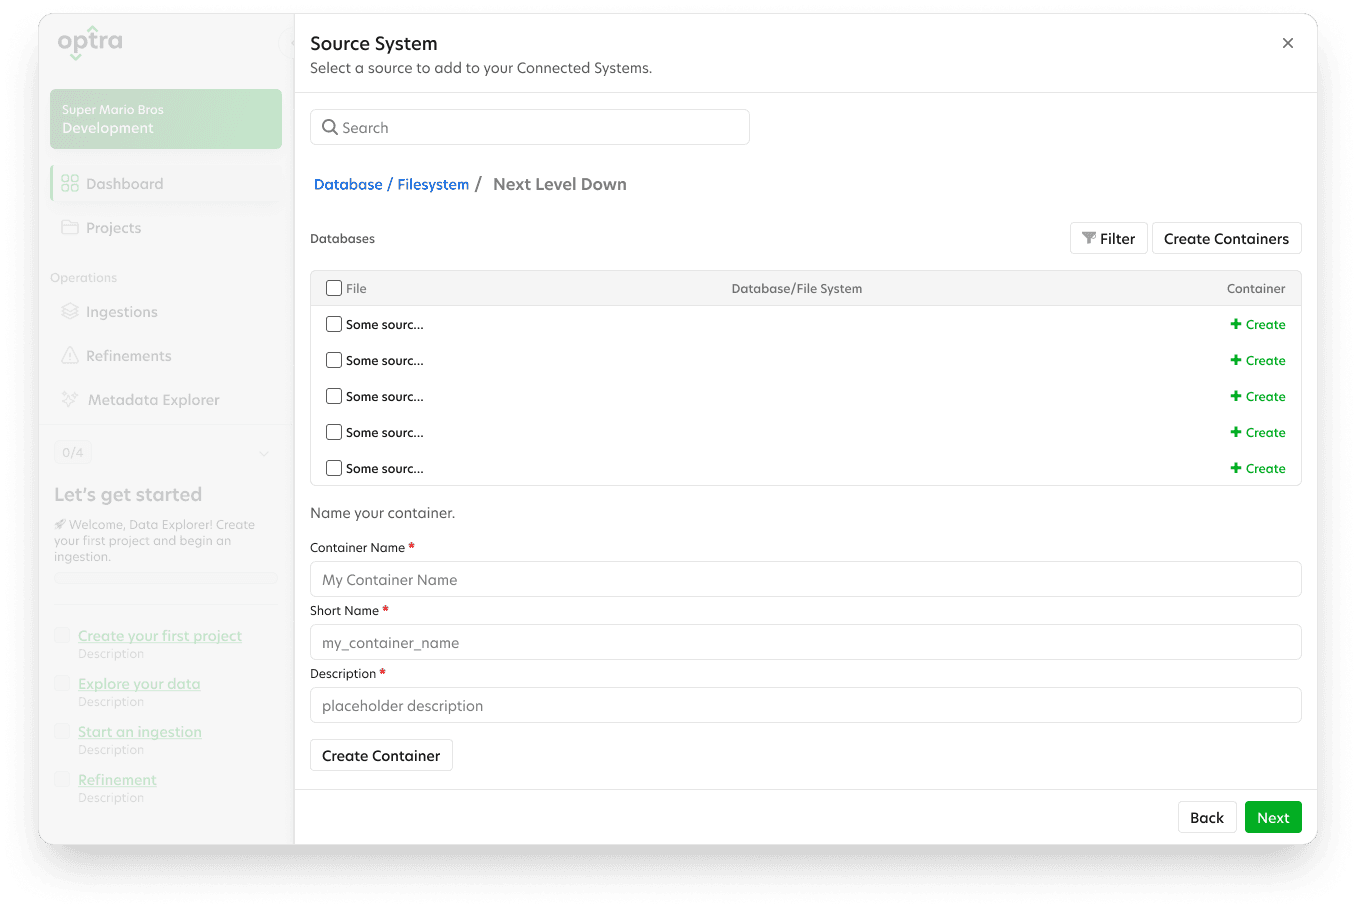
After gathering feedback about the onboarding guide, I worked with a UI designer to polish it into a modern UI. The new design was a success and now ready to be moved to development, while the next stages of the process (data ingestion and refinement) could be designed.
Feedback
Our short timeline prohibited formal usability tests, but I was still able to present the new experience to users to capture attitudinal feedback about the changes through a series of cognitive walkthroughs.
Goals: Validate the redesigned workflows and UI with real users to ensure alignment with their needs and goals.
Outcome: Feedback showed that the prototype significantly improved task completion time and user satisfaction. The reduction in data entry also decreased the users' perception of complexity of the app so it didn't feel overwhelming.
Refining Based On User Input
After gathering feedback about the onboarding guide, I worked with a UI designer to polish it into a modern UI. The new design was a success and now ready to be moved to development, while the next stages of the process (data ingestion and refinement) could be designed.
Conclusion
The redesign transformed Optra Data Accelerator into a user-friendly application that empowers data professionals to focus on their goals without being hindered by complex coding or cumbersome workflows. The onboarding process was reduced from 23 minutes down to 7 minutes.
Next Steps: After the onboarding workflow, data refinement was next to be designed.
Feedback
Our short timeline prohibited me from conducting more robust usability tests, but I was still able to present the new onboarding experience to users to capture attitudinal feedback about the changes through a series of cognitive walkthroughs.
Goals: Validate the redesigned workflows and UI with real users to ensure alignment with their needs and goals.
Outcome: Feedback showed that the prototype significantly improved task completion time and user satisfaction. The reduction in data entry also decreased the users' perception of complexity of the app so it didn't feel overwhelming.
Refining Based On User Input
After gathering feedback about the onboarding guide, I worked with a UI designer to polish it into a modern UI. The new design was a success and now ready to be moved to development, while the next stages of the process (data ingestion and refinement) could be designed.
Conclusion
This redesign transformed the Optra Data Accelerator into a user-friendly application that empowers data professionals to focus on their goals without being hindered by complex coding or cumbersome workflows. The onboarding process was reduced from 23 minutes down to 7 minutes.
Next Steps: After the onboarding workflow, the process of data refinement was next to be designed.
The Problem
To glean insight from data in order to make business decisions, a company needs high quality data. To go from raw to data that has been cleaned, standardized, and aggregated so it can be stored in a Data Lakehouse, a data engineer needs to build data pipelines to facilitate the transfer. A popular tool for this is Databricks, however the current process is slow (weeks can be spent building the pipelines) and requires programming knowledge.
The Optra Data Accelerator began as a proof of concept that allows users to create pipelines without writing code. It had great technical potential, but lacked an intuitive user experience. Users found the interface confusing, the workflows disjointed, and the overall process difficult to follow. The challenge was to redesign the pipeline creation process while reducing the learning curve.
Our Approach
Stakeholder Interviews
We began with stakeholder interviews to learn about the data science lifecycle and how data is collected and used in large enterprises. The interviews also clarified different roles of the users involved: data analysts, engineers, scientists, and machine learning operations leaders.
Goals: Understand the vision for ODA and align the UX design with business objectives--increasing adoption among data engineers and improving efficiency.
The stakeholders were aligned on creating a great onboarding and first-use experience. This would be a new way for engineers to work, so they need to get set up quickly and show the value of the tool in the first few minutes of use.
Stakeholder
Interviews
Track 1
Non-user Interviews
Current-user Interviews
Current
Future
Track 2
Improve
Current Features
Future Releases
New Info
New Info
New Info
Stakeholder
Interviews
Track 1
Non-user Interviews
Current-user Interviews
Current
Future
Track 2
Improve
Current Features
Future Releases
New Info
New Info
New Info
Primary Research
Planning: I developed a research plan that split into two tracks. One started with in-depth interviews with data scientists and engineers. The goal was to understand the challenges they face throughout the data lifecycle. This would help evaluate the proof of concept and begin creating solutions for future features.
Since we had a working POC, the second track of research focused on existing users. I led observation sessions where the users could walk me through their current use of the ODA to see how they used it, what they liked and disliked, and find pain points we could improve.
Conducting: I Interviewed 11 data scientists and engineers, and observed 3 using the accelerator.
Outcomes/Synthesis: Observations were distilled into insights, then mapped to the overall data lifecycle. This process map helped us focus on the specific area ODA should target, while revealing other challenges that weren't covered in the stakeholder interviews but are still crucial to the users. For example, when scientists are creating models that are used with the data, they currently have no way to associate what they're working on to the business goals the model is trying to solve. This causes problems down the road when working on specific business initiatives and creating baseline and key performance indicators for overall improvement.
Research Findings Workshop
Are We Focusing On What Really Matters?
The research results were presented in a half day workshop where stakeholders could take in the findings and we could align on next steps.
During the workshop I facilitated a prioritization exercise where we went through the process map and ranked yes/no/maybe (green/red/yellow) the areas the product owners wanted to focus on moving forward, or calling out specifically what features the ODA would not address.